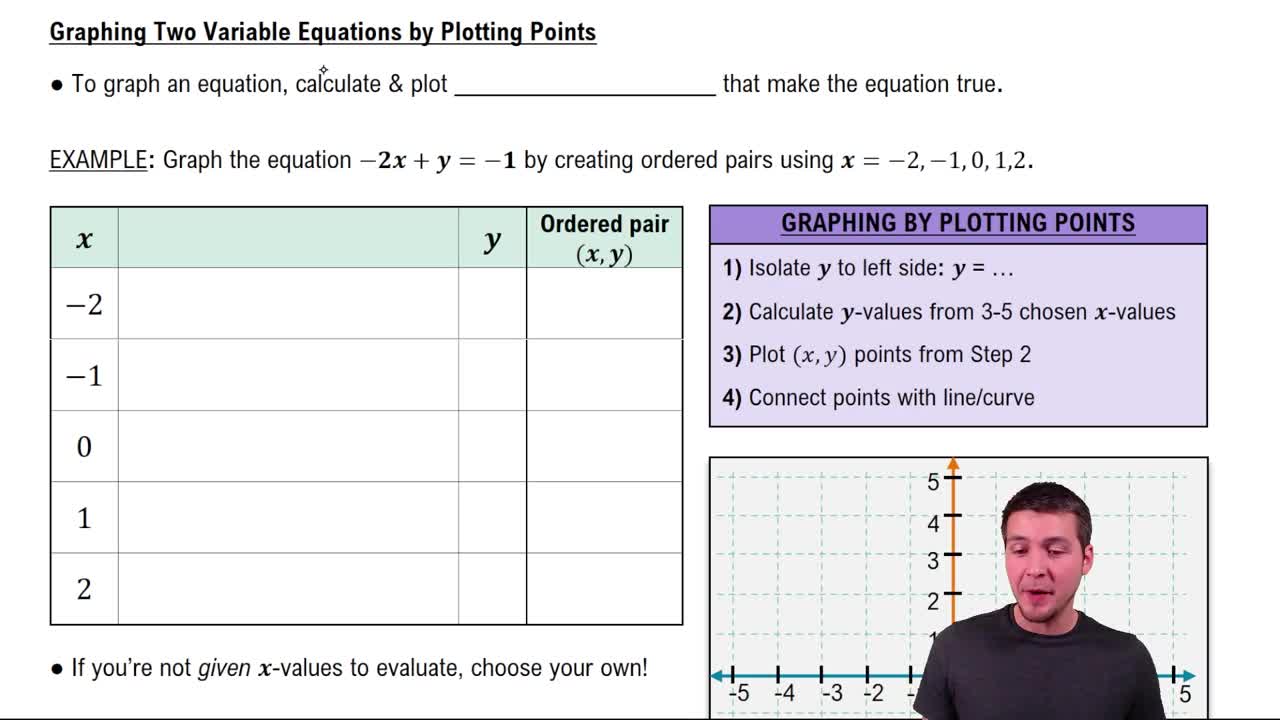
Graph each equation in Exercises 1–4. Let x= -3, -2. -1, 0, 1, 2 and 3. y = |x|-2
Verified step by step guidance
1
Step 1: Understand the equation y = |x| - 2. The absolute value function |x| represents the distance of x from 0 on the number line, and it is always non-negative. Subtracting 2 shifts the graph of |x| downward by 2 units.
Step 2: Create a table of values for x and y. Use the given x-values (-3, -2, -1, 0, 1, 2, 3). For each x-value, calculate y by substituting x into the equation y = |x| - 2. For example, when x = -3, |x| = 3, so y = 3 - 2 = 1.
Step 3: Continue calculating y for each x-value. For x = -2, |x| = 2, so y = 2 - 2 = 0. For x = -1, |x| = 1, so y = 1 - 2 = -1. For x = 0, |x| = 0, so y = 0 - 2 = -2. Repeat this process for x = 1, 2, and 3.
Step 4: Plot the points (x, y) on a coordinate plane. Use the calculated values from the table. For example, plot (-3, 1), (-2, 0), (-1, -1), (0, -2), (1, -1), (2, 0), and (3, 1).
Step 5: Connect the points to form the graph. The graph will have a V-shape because the absolute value function |x| is symmetric about the y-axis. The vertex of the graph will be at (0, -2), and the arms of the V will extend upward on both sides.
Verified video answer for a similar problem:
This video solution was recommended by our tutors as helpful for the problem above
Video duration:
3m
Play a video:
0 Comments
Key Concepts
Here are the essential concepts you must grasp in order to answer the question correctly.
Absolute Value Function
The absolute value function, denoted as |x|, measures the distance of a number x from zero on the number line, always yielding a non-negative result. For example, |3| = 3 and |-3| = 3. This function is crucial for understanding how the graph behaves, particularly at the origin and for negative inputs.
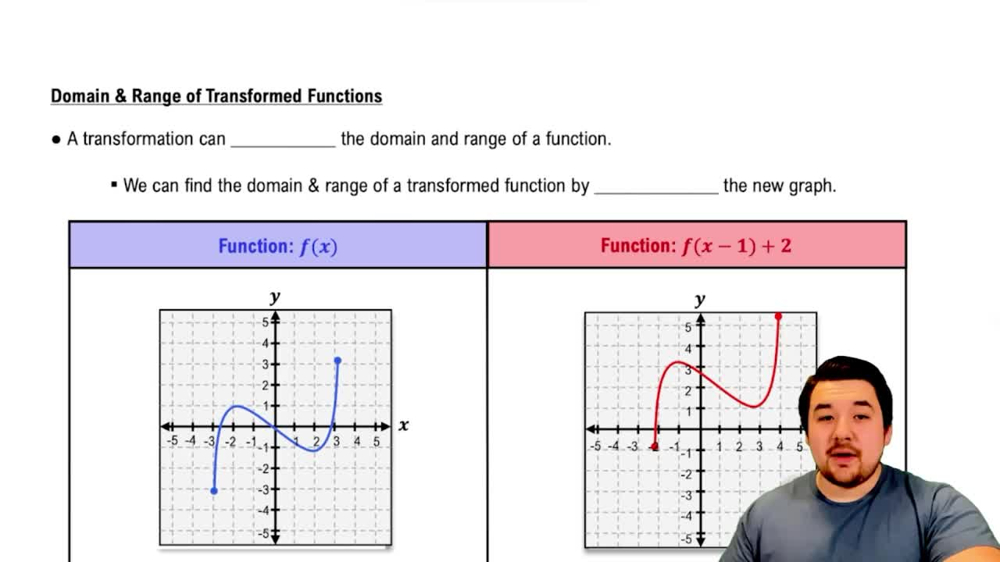
Transformations involve shifting, reflecting, stretching, or compressing the graph of a function. In the equation y = |x| - 2, the graph of |x| is shifted downward by 2 units. Understanding transformations helps in predicting how the graph will look based on modifications to the original function.
Graphing points involves plotting coordinates on a Cartesian plane, where each point corresponds to an (x, y) pair. For the given equation, we will calculate y for each specified x value, such as x = -3, -2, -1, 0, 1, 2, and 3, and then plot these points to visualize the graph of the function.

 Verified step by step guidance
 4:56
4:56