Identify the inequality to graph: \(x + 2y \leq 8\).
Rewrite the inequality in slope-intercept form by isolating \(y\): subtract \(x\) from both sides to get \(2y \leq 8 - x\), then divide both sides by 2 to obtain \(y \leq \frac{8 - x}{2}\).
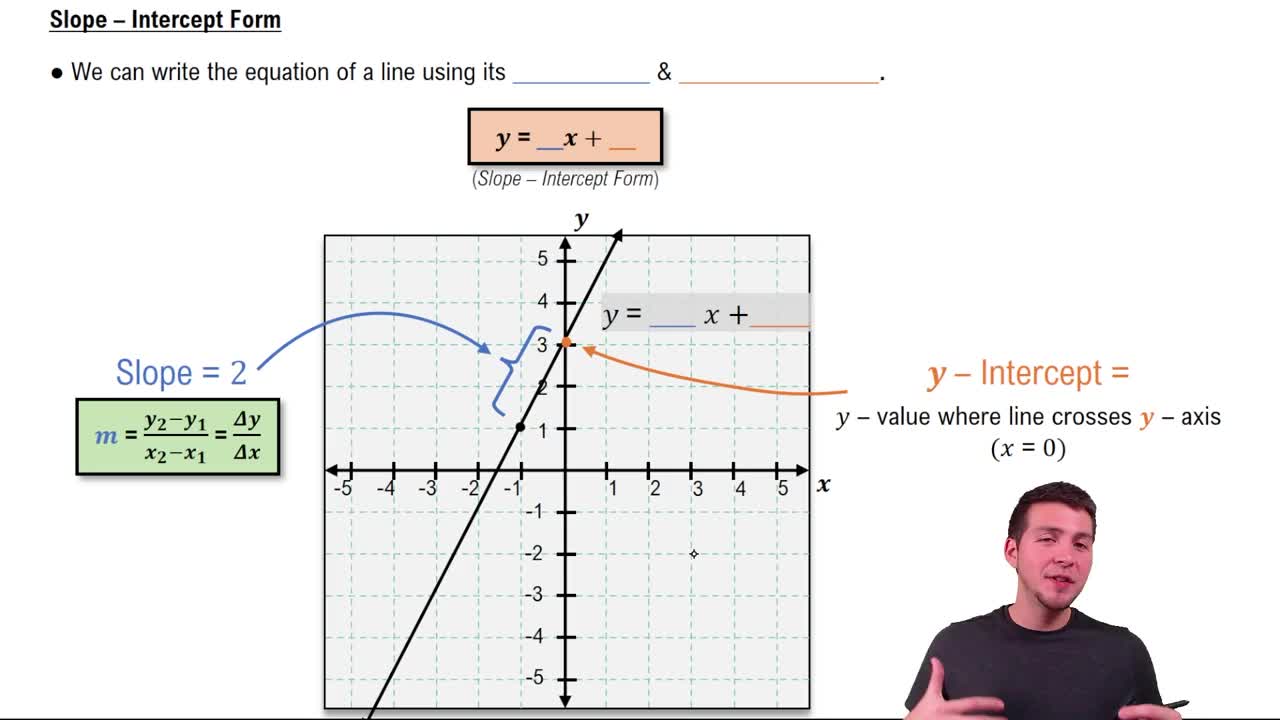
Graph the boundary line \(y = \frac{8 - x}{2}\), which can be rewritten as \(y = 4 - \frac{1}{2}x\). This is a straight line with a y-intercept of 4 and a slope of \(-\frac{1}{2}\).
Since the inequality is \(\leq\) (less than or equal to), draw the boundary line as a solid line to indicate that points on the line satisfy the inequality.
Shade the region below the line because \(y\) is less than or equal to \(4 - \frac{1}{2}x\). You can test a point not on the line, such as \((0,0)\), to confirm which side to shade by substituting into the inequality.
Verified video answer for a similar problem:
This video solution was recommended by our tutors as helpful for the problem above
Video duration:
6m
Play a video:
0 Comments
Key Concepts
Here are the essential concepts you must grasp in order to answer the question correctly.
Graphing Linear Inequalities
Graphing linear inequalities involves first graphing the related linear equation as a boundary line. The inequality symbol determines whether the boundary is solid (≤ or ≥) or dashed (< or >). The solution region is the set of points that satisfy the inequality, typically shaded on one side of the boundary line.
Rearranging the inequality into slope-intercept form (y = mx + b) helps in graphing. For example, x + 2y ≤ 8 can be rewritten as y ≤ -1/2 x + 4. This form clearly shows the slope and y-intercept, making it easier to plot the boundary line accurately.
After graphing the boundary line, select a test point not on the line (often the origin) to check if it satisfies the inequality. If it does, shade the region containing that point; if not, shade the opposite side. This step ensures the correct half-plane is identified as the solution set.

 Verified step by step guidance
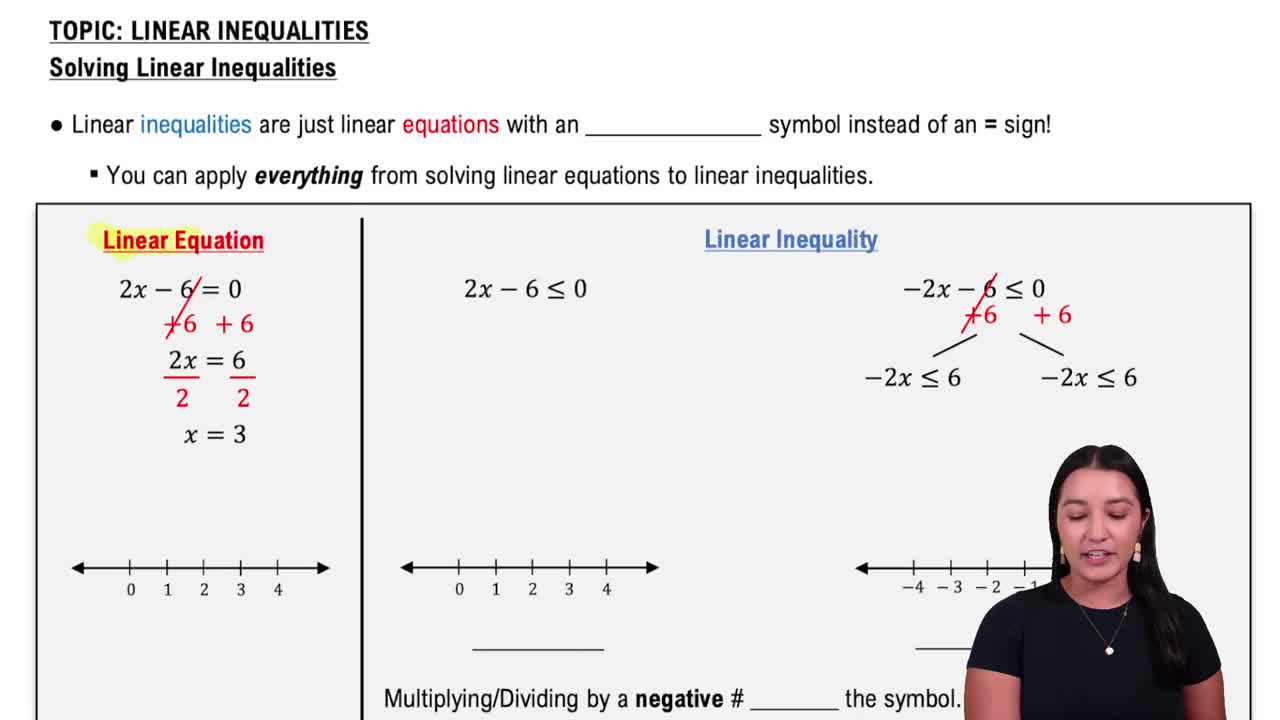
 06:07
06:07