Skip to main content
College Algebra
My Course
Learn
Exam Prep
AI Tutor
Study Guides
Textbook Solutions
Flashcards
Explore
Try the app
My Course
Learn
Exam Prep
AI Tutor
Study Guides
Textbook Solutions
Flashcards
Explore
Try the app
Back
Graphing Rational Functions definitions
You can tap to flip the card.
Rational Function
You can tap to flip the card.
👆
Rational Function
An expression formed by dividing one polynomial by another, often exhibiting asymptotes and restricted domains.
Track progress
Control buttons has been changed to "navigation" mode.
1/15
Related flashcards
Related practice
Recommended videos
Graphing Rational Functions quiz
Graphing Rational Functions
15 Terms
Graphing Rational Functions
5. Rational Functions
5 problems
Topic
Justin
Asymptotes
5. Rational Functions
5 problems
Topic
Callie
5. Rational Functions
3 topics
7 problems
Chapter
Callie
5:31
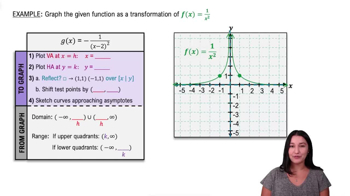
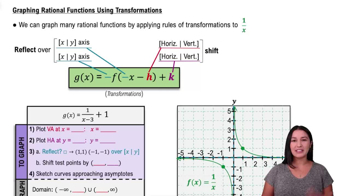
Graphing Rational Functions Using Transformations
2523
views
37
rank
1
comments
3:08
Example 1
1453
views
15
rank
10:18
Example 1
1206
views
19
rank
Terms in this set (15)
Hide definitions
Rational Function
An expression formed by dividing one polynomial by another, often exhibiting asymptotes and restricted domains.
Transformation
A change applied to a graph, such as shifting, reflecting, or stretching, altering its position or orientation.
Vertical Asymptote
A dashed line where the graph approaches but never touches, occurring where the denominator equals zero.
Horizontal Asymptote
A dashed line indicating the value a function approaches as x becomes very large or very small.
Reflection
A flip of the graph over the x-axis or y-axis, determined by a negative sign outside or inside the function.
Horizontal Shift
A movement of the graph left or right, determined by the value subtracted from x inside the function.
Vertical Shift
A movement of the graph up or down, determined by a constant added or subtracted outside the function.
Domain
All possible x-values for which the function is defined, often excluding values that make the denominator zero.
Range
All possible y-values the function can take, typically split by horizontal asymptotes.
X-intercept
A point where the graph crosses the x-axis, found by setting the numerator equal to zero.
Y-intercept
A point where the graph crosses the y-axis, found by evaluating the function at x equals zero.
Multiplicity
The number of times a factor appears in the numerator or denominator, affecting how the graph behaves at intercepts.
Interval
A section of the x-axis between key points like asymptotes or intercepts, used to analyze graph behavior.
Set Notation
A mathematical way to describe domain and range, often using symbols like parentheses and union.
Leading Coefficient
The coefficient of the highest degree term in a polynomial, used to determine horizontal asymptotes.
 BackBack

 5:31
5:31