Textbook Question
In all exercises, other than exercises with no solution, use interval notation to express solution sets and graph each solution set on a number line. In Exercises 27–50, solve each linear inequality. 1 - x/2 > 4
770
views

 Verified step by step guidance
 04:08 04:08
 02:16
02:16In all exercises, other than exercises with no solution, use interval notation to express solution sets and graph each solution set on a number line. In Exercises 27–50, solve each linear inequality. 1 - x/2 > 4
In Exercises 35–46, determine the constant that should be added to the binomial so that it becomes a perfect square trinomial. Then write and factor the trinomial.
In Exercises 37–52, perform the indicated operations and write the result in standard form. (- 3 - √-7)2
Solve each equation in Exercises 41–60 by making an appropriate substitution.
In all exercises, other than exercises with no solution, use interval notation to express solution sets and graph each solution set on a number line. In Exercises 27–50, solve each linear inequality. x/4 - 3/2 ≤ x/2 + 1
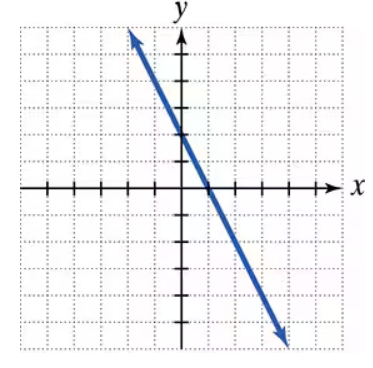
Use the graph to a. determine the x-intercepts, if any; b. determine the y-intercepts, if any. For each graph, tick marks along the axes represent one unit each.