Textbook Question
Solve and check each linear equation. 3(x - 1) = 21
1006
views

 Verified step by step guidance
 04:08 04:08
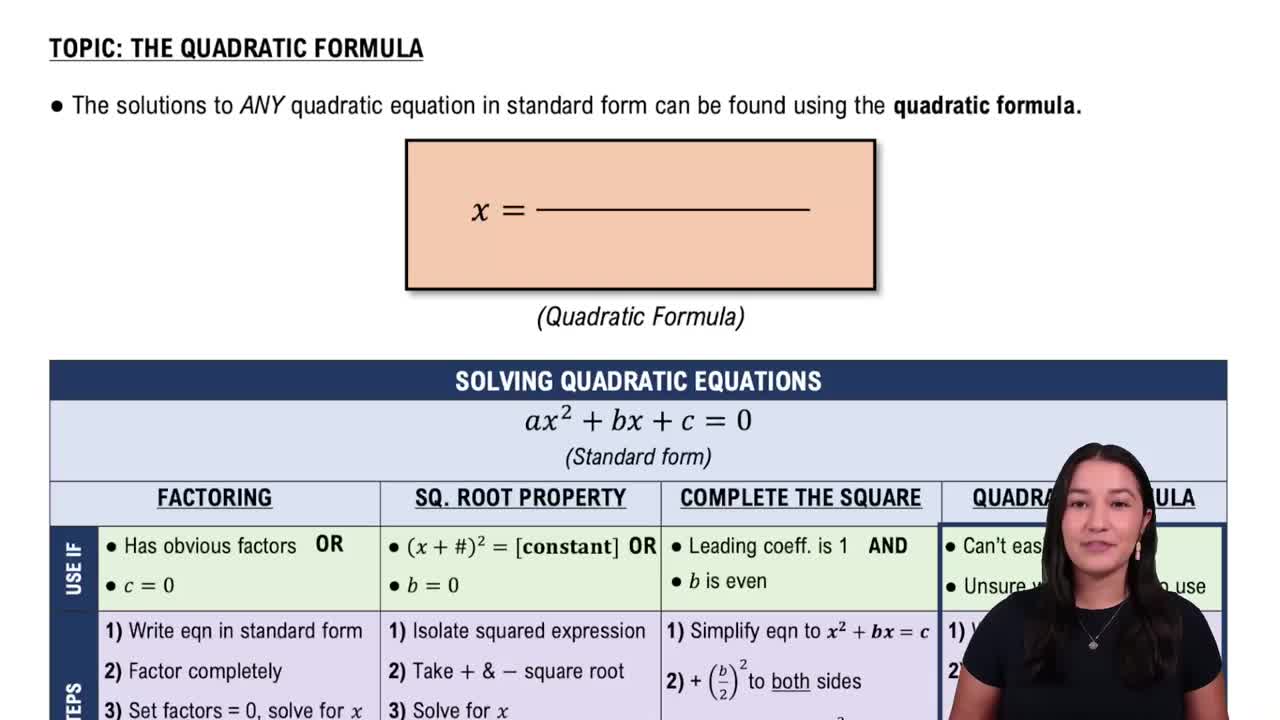 06:36
06:36Solve and check each linear equation. 3(x - 1) = 21
A new car worth \$36,000 is depreciating in value by \$4000 per year. a. Write a formula that models the car's value, y, in dollars, after x years. b. Use the formula from part (a) to determine after how many years the car's value will be \$12,000. c. Graph the formula from part (a) in the first quadrant of a rectangular coordinate system. Then show your solution to part (b) on the graph.
In Exercises 1–14, express each interval in set-builder notation and graph the interval on a number line. (2, ∞)
Solve each equation in Exercises 1 - 14 by factoring.
Plot the given point in a rectangular coordinate system. (- 4, - 2)
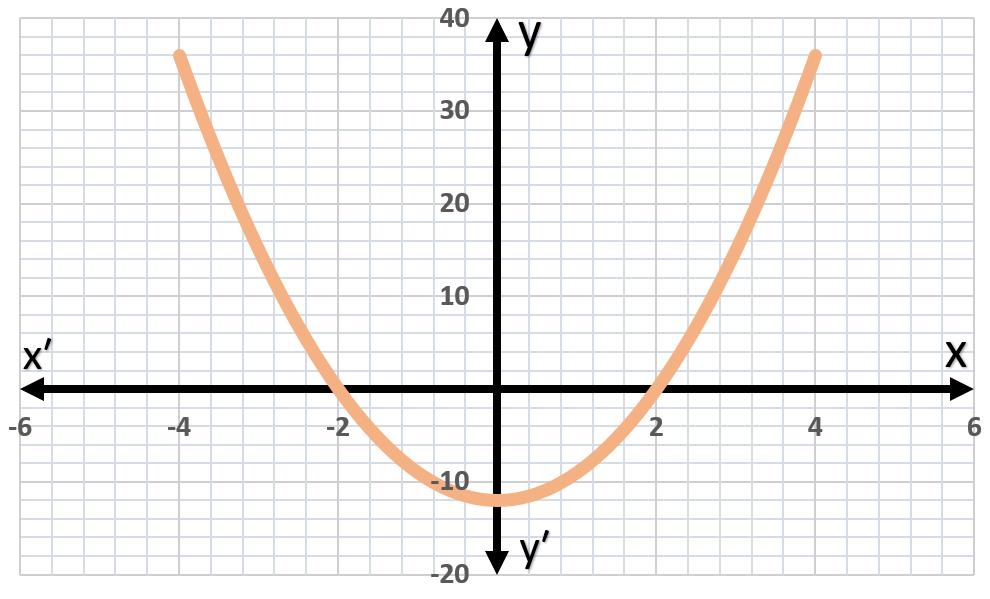
In Exercises 6–8, use the graph and determine the x-intercepts if any, and the y-intercepts if any. For each graph, tick marks along the axes represent one unit each.