Textbook Question
Find f−g and determine the domain for each function. f(x) = x -5, g(x) = 3x²
864
views

 Verified step by step guidance
 4:22
4:22 5:34
5:34 5:26
5:26Find f−g and determine the domain for each function. f(x) = x -5, g(x) = 3x²
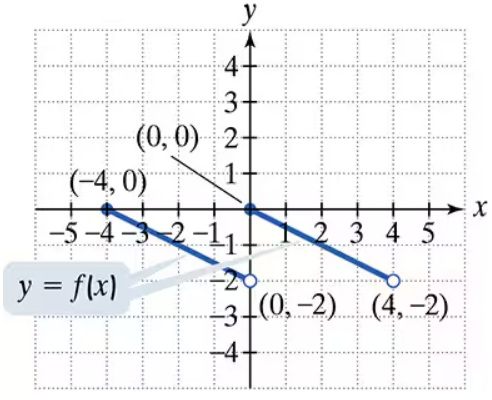
Which graphs in Exercises 29–34 represent functions that have inverse functions?
Evaluate each function at the given values of the independent variable and simplify. h(x) = x³ − x + 1 d. h (3a)
Find ƒ+g and determine the domain for each function. f(x) = x -5, g(x) = 3x²
Evaluate each function at the given values of the independent variable and simplify. h(x) = x³ − x + 1 c. h (-x)
Write the standard form of the equation of the circle with the given center and radius. Center (3, 2), r = 5