Textbook Question
Find and interpret the average rate of change illustrated in each graph.
1511
views

 Verified step by step guidance
 5:22
5:22 04:02
04:02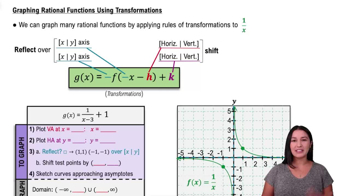 5:31
5:31Find and interpret the average rate of change illustrated in each graph.
Graph each function.
Use a graphing calculator to solve each linear equation. 3(2x+1) - 2 (x-2) =5
Graph each function.
Solve each problem. A graph of y=ƒ(x) is shown in the standard viewing window. Which is the only value of x that could possibly be the solution of the equation ƒ(x) =0? A. -15 B. 0 C. 5 D. 15
Graph each function. See Examples 6–8 and the Summary of Graphing Techniques box following Example 9. g(x)=(x+2)2