Textbook Question
Use one of the end behavior diagrams below, to describe the end behavior of the graph of each polynomial function.
829
views


 Verified step by step guidance
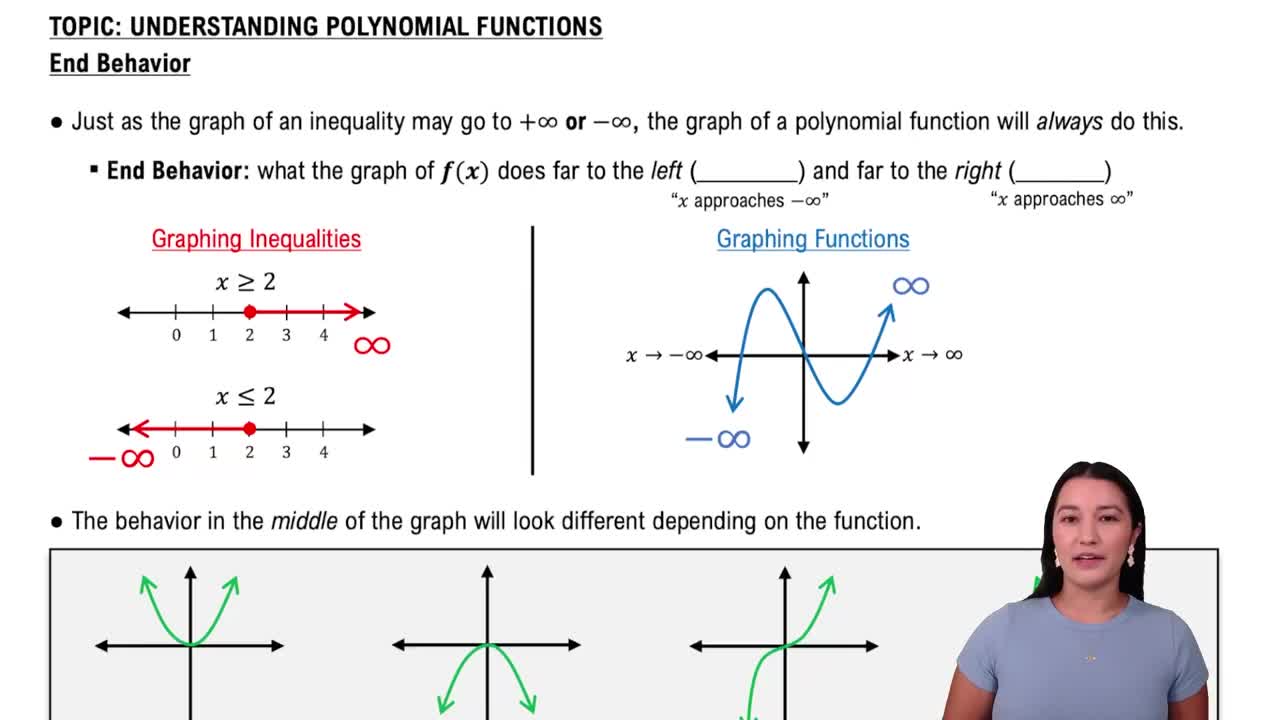
 06:08
06:08 05:16 06:08
Use one of the end behavior diagrams below, to describe the end behavior of the graph of each polynomial function.
Graph each quadratic function. Give the (a) vertex, (b) axis, (c) domain, and (d) range. ƒ(x) = (x - 2)2
Use synthetic division to perform each division. x7+1 / x+1
Use an end behavior diagram, as shown below, to describe the end behavior of the graph of each polynomial function. ƒ(x)=9x6-3x4+x2-2
Solve each polynomial inequality. Give the solution set in interval notation. See Examples 2 and 3. (2x - 1)(5x - 9)(x - 4) < 0
Factor ƒ(x) into linear factors given that k is a zero.