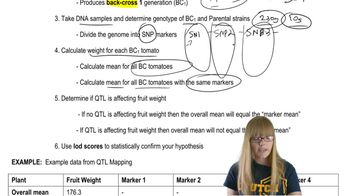
In a series of crosses between two true-breeding strains of peaches, the F₁ generation was uniform, producing 30-g peaches. The F₂ fruit mass ranges from 38 to 22 g at intervals of 2 g. Using these data, determine the number of polygenic loci involved in the inheritance of peach mass.
Verified step by step guidance
1
Step 1: Understand the problem. The inheritance of peach mass is polygenic, meaning multiple loci contribute to the trait. The F₁ generation is uniform, indicating that the two true-breeding strains are homozygous for different alleles at all loci. The F₂ generation shows a range of phenotypes, suggesting segregation of alleles at multiple loci.
Step 2: Identify the phenotypic range in the F₂ generation. The smallest peach mass is 22 g, and the largest is 38 g, giving a total range of 16 g. The phenotypic intervals are 2 g, meaning there are discrete steps in the trait expression.
Step 3: Calculate the number of phenotypic classes. Divide the total range (16 g) by the interval size (2 g) and add 1 to account for the inclusive range. This gives the number of distinct phenotypic classes in the F₂ generation.
Step 4: Use the formula for polygenic inheritance to determine the number of loci. The number of phenotypic classes in the F₂ generation is given by the formula \( 2n + 1 \), where \( n \) is the number of polygenic loci. Solve for \( n \) by equating \( 2n + 1 \) to the number of phenotypic classes calculated in Step 3.
Step 5: Interpret the result. The value of \( n \) represents the number of polygenic loci involved in the inheritance of peach mass. This calculation assumes that all loci contribute equally and independently to the trait, and there is no environmental influence.
Verified video answer for a similar problem:
This video solution was recommended by our tutors as helpful for the problem above
Video duration:
2m
Play a video:
Was this helpful?
Key Concepts
Here are the essential concepts you must grasp in order to answer the question correctly.
Polygenic Inheritance
Polygenic inheritance refers to the phenomenon where multiple genes (loci) contribute to a single trait, resulting in a continuous range of phenotypes. In the case of peach mass, the variation in fruit weight suggests that several genes are influencing this trait, rather than a single gene with dominant and recessive alleles.
Quantitative Trait Loci (QTL) are specific regions of the genome that are associated with the variation in a quantitative trait, such as fruit mass. By analyzing the distribution of phenotypes in the F₂ generation, researchers can estimate the number of QTLs involved in the trait's inheritance, which helps in understanding the genetic architecture of complex traits.
Phenotypic variation refers to the observable differences in traits among individuals, which can be influenced by genetic and environmental factors. The range of peach masses from 22 g to 38 g, with specific intervals, indicates a normal distribution typical of polygenic traits, allowing for the estimation of the number of loci based on the observed variation.