The ABO and MN blood groups are shown for four sets of parents (1 to 4) and four children (a to d). Recall that the ABO blood group has three alleles: IA, IB and i. The MN blood group has two codominant alleles, M and N. Using your knowledge of these genetic systems, match each child with every set of parents who might have conceived the child, and exclude any parental set that could not have conceived the child.
Table of contents
- 1. Introduction to Genetics51m
- 2. Mendel's Laws of Inheritance3h 37m
- 3. Extensions to Mendelian Inheritance2h 41m
- 4. Genetic Mapping and Linkage2h 28m
- 5. Genetics of Bacteria and Viruses1h 21m
- 6. Chromosomal Variation1h 48m
- 7. DNA and Chromosome Structure56m
- 8. DNA Replication1h 10m
- 9. Mitosis and Meiosis1h 34m
- 10. Transcription1h 0m
- 11. Translation58m
- 12. Gene Regulation in Prokaryotes1h 19m
- 13. Gene Regulation in Eukaryotes44m
- 14. Genetic Control of Development44m
- 15. Genomes and Genomics1h 50m
- 16. Transposable Elements47m
- 17. Mutation, Repair, and Recombination1h 6m
- 18. Molecular Genetic Tools19m
- 19. Cancer Genetics29m
- 20. Quantitative Genetics1h 26m
- 21. Population Genetics50m
- 22. Evolutionary Genetics29m
3. Extensions to Mendelian Inheritance
Variations of Dominance
Problem 8g
Textbook Question
Two genes interact to produce various phenotypic ratios among F₂ progeny of a dihybrid cross. Design a different pathway explaining each of the F₂ ratios below, using hypothetical genes R and T and assuming that the dominant allele at each locus catalyzes a different reaction or performs an action leading to pigment production. The recessive allele at each locus is null (loss-of-function). Begin each pathway with a colorless precursor that produces a white or albino phenotype if it is unmodified. The ratios are for F₂ progeny produced by crossing wild-type F₁ organisms with the genotype RrTt.
13/16 white : 3/16 green
 Verified step by step guidance
1
Step 1: Understand the problem. The F₂ phenotypic ratio of 13/16 white : 3/16 green suggests that there is an epistatic interaction between two genes (R and T). Epistasis occurs when one gene's expression masks or modifies the effect of another gene. Here, the dominant alleles of R and T are involved in pigment production, while the recessive alleles are null (loss-of-function).
Step 2: Define the pathway. Start with a colorless precursor. Assume that gene R catalyzes the first step in the pathway, converting the precursor into an intermediate product. If R is null (rr), the precursor remains unmodified, resulting in a white phenotype.
Step 3: Add the second gene's role. Assume that gene T acts on the intermediate product produced by R to convert it into a green pigment. If T is null (tt), the intermediate product cannot be converted into the green pigment, resulting in a white phenotype.
Step 4: Explain the phenotypic ratio. The 13/16 white phenotype can be explained by the following genotypes: (1) rrT_ (where R is null, so the precursor remains unmodified), (2) R_tt (where T is null, so the intermediate product cannot be converted to green), and (3) rrtt (where both genes are null). The 3/16 green phenotype occurs only when both R and T are functional (R_T_).
Step 5: Summarize the genetic interaction. This is an example of dominant epistasis, where the presence of a dominant allele at one locus (R or T) can mask the effect of the other gene. The pathway can be summarized as: Colorless precursor --(R)--> Intermediate product --(T)--> Green pigment. If either R or T is null, the pathway is blocked, resulting in a white phenotype.
 Verified video answer for a similar problem:
This video solution was recommended by our tutors as helpful for the problem above
Video duration:
2mPlay a video:
Was this helpful?
Key Concepts
Here are the essential concepts you must grasp in order to answer the question correctly.
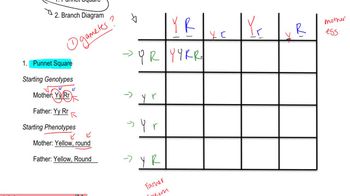
Dihybrid Cross
A dihybrid cross involves two traits, each controlled by different genes, typically represented by two pairs of alleles. In this scenario, the genes R and T are being studied, where each gene can have a dominant or recessive allele. The phenotypic ratios observed in the offspring result from the independent assortment of these alleles during gamete formation, leading to various combinations in the F₂ generation.
Recommended video:
Guided course

Punnet Square
Phenotypic Ratios
Phenotypic ratios describe the relative frequencies of different phenotypes in the offspring resulting from a genetic cross. In this case, the ratio of 13/16 white to 3/16 green indicates that the majority of the F₂ progeny exhibit a white phenotype, while a smaller proportion shows green. Understanding these ratios helps in deducing the underlying genetic interactions and the effects of dominant and recessive alleles.
Recommended video:
Guided course

Mutations and Phenotypes
Gene Interaction and Pathways
Gene interaction refers to the way different genes influence each other's expression and the resulting phenotype. In this context, the dominant alleles R and T catalyze distinct reactions that modify a colorless precursor into pigments. The proposed pathways must account for how these interactions lead to the observed phenotypic ratios, illustrating the complexity of genetic control over traits such as color in organisms.
Recommended video:
Guided course

Interacting Genes Overview

 4:37m
4:37mWatch next
Master Variations on Dominance with a bite sized video explanation from Kylia
Start learningRelated Videos
Related Practice
Textbook Question
1035
views
