In a large metropolitan hospital, cells from newborn babies are collected and examined microscopically over a 5-year period. Among approximately 7500 newborn males, six have one Barr body in the nuclei of their somatic cells. All other newborn males have no Barr bodies. Among 7500 female infants, four have two Barr bodies in each nucleus, two have no Barr bodies, and the rest have one. What is the cause of the unusual number of Barr bodies in a small number of male and female infants?
Table of contents
- 1. Introduction to Genetics51m
- 2. Mendel's Laws of Inheritance3h 37m
- 3. Extensions to Mendelian Inheritance2h 41m
- 4. Genetic Mapping and Linkage2h 28m
- 5. Genetics of Bacteria and Viruses1h 21m
- 6. Chromosomal Variation1h 48m
- 7. DNA and Chromosome Structure56m
- 8. DNA Replication1h 10m
- 9. Mitosis and Meiosis1h 34m
- 10. Transcription1h 0m
- 11. Translation58m
- 12. Gene Regulation in Prokaryotes1h 19m
- 13. Gene Regulation in Eukaryotes44m
- 14. Genetic Control of Development44m
- 15. Genomes and Genomics1h 50m
- 16. Transposable Elements47m
- 17. Mutation, Repair, and Recombination1h 6m
- 18. Molecular Genetic Tools19m
- 19. Cancer Genetics29m
- 20. Quantitative Genetics1h 26m
- 21. Population Genetics50m
- 22. Evolutionary Genetics29m
2. Mendel's Laws of Inheritance
Monohybrid Cross
Problem 18
Textbook Question
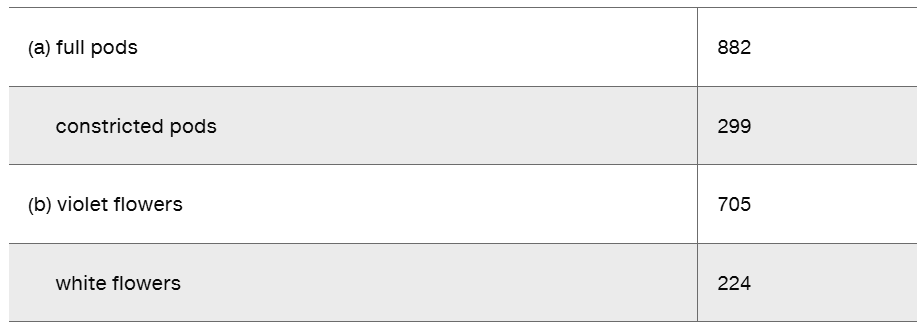
The following are F₂ results of two of Mendel's monohybrid crosses.

For each cross, state a null hypothesis to be tested using x² analysis. Calculate the x² value and determine the p value for both. Interpret the p-values. Can the deviation in each case be attributed to chance or not? Which of the two crosses shows a greater amount of deviation?
 Verified step by step guidance
1
Step 1: State the null hypothesis for each cross. For Mendel's monohybrid crosses, the null hypothesis typically states that the observed phenotypic ratios follow the expected Mendelian ratio of 3:1 (dominant to recessive phenotype). So, for both crosses, the null hypothesis is: "The observed phenotypic ratios fit a 3:1 ratio."
Step 2: Calculate the expected numbers for each phenotype based on the total observed individuals and the expected 3:1 ratio. For each cross, sum the observed counts to get the total number of individuals (N). Then calculate expected counts as follows: \(Expected_{dominant} = \frac{3}{4} \times N\) and \(Expected_{recessive} = \frac{1}{4} \times N\).
Step 3: Use the chi-square formula to calculate the chi-square (\(\chi^2\)) value for each cross:
\(\chi^2 = \sum \frac{(Observed - Expected)^2}{Expected}\)
Calculate this separately for each phenotype and then sum the values to get the total \(\chi^2\) for each cross.
Step 4: Determine the degrees of freedom (df) for the test. Since there are two phenotypic categories (dominant and recessive), the degrees of freedom is \(df = number\ of\ categories - 1 = 2 - 1 = 1\). Use the chi-square distribution table to find the p-value corresponding to the calculated \(\chi^2\) value and 1 degree of freedom.
Step 5: Interpret the p-values for each cross. If the p-value is greater than 0.05, the deviation from the expected ratio can be attributed to chance, and we fail to reject the null hypothesis. If the p-value is less than 0.05, the deviation is statistically significant, and we reject the null hypothesis. Compare the \(\chi^2\) values to determine which cross shows a greater amount of deviation from the expected ratio.
 Verified video answer for a similar problem:
This video solution was recommended by our tutors as helpful for the problem above
Video duration:
2mPlay a video:
Was this helpful?
Key Concepts
Here are the essential concepts you must grasp in order to answer the question correctly.
Mendelian Monohybrid Cross and Expected Ratios
A monohybrid cross involves one gene with two alleles, typically showing a 3:1 phenotypic ratio in the F2 generation if one allele is dominant. Mendel's experiments established these expected ratios, which serve as a baseline for testing genetic hypotheses. Understanding these ratios is essential for comparing observed data to expected outcomes.
Recommended video:
Guided course

Monohybrid Cross
Chi-Square (χ²) Test for Goodness of Fit
The chi-square test evaluates whether observed data deviate significantly from expected ratios due to chance. It calculates a χ² value by summing the squared differences between observed and expected counts, divided by expected counts. This test helps determine if deviations are statistically significant or likely due to random variation.
Recommended video:
Guided course

Chi Square Analysis
Interpreting p-Values and Hypothesis Testing
The p-value derived from the χ² test indicates the probability that observed deviations occurred by chance under the null hypothesis. A high p-value (usually >0.05) suggests no significant deviation, supporting the null hypothesis, while a low p-value indicates significant deviation. This interpretation guides conclusions about genetic inheritance patterns.
Recommended video:
Guided course

Chi Square and Linkage
Related Videos
Related Practice
Textbook Question
539
views


