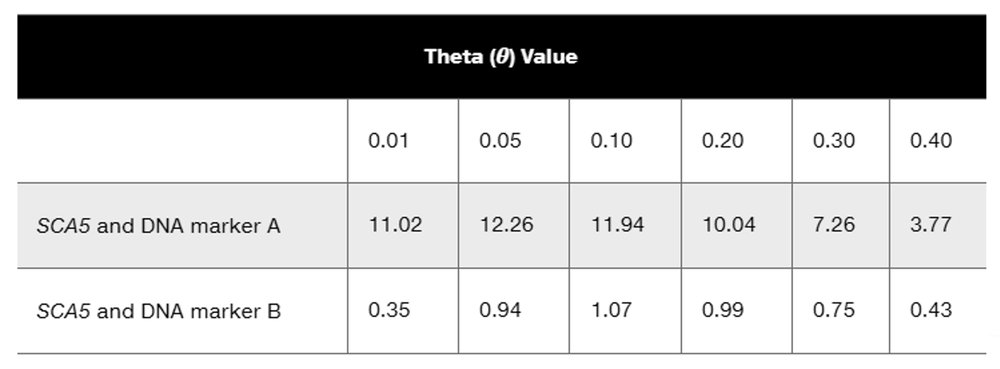
A number of human–mouse somatic cell hybrid clones were examined for the expression of specific human genes and the presence of human chromosomes. The results are summarized in the following table. Assign each gene to the chromosome on which it is located.
Table of contents
- 1. Introduction to Genetics51m
- 2. Mendel's Laws of Inheritance3h 37m
- 3. Extensions to Mendelian Inheritance2h 41m
- 4. Genetic Mapping and Linkage2h 28m
- 5. Genetics of Bacteria and Viruses1h 21m
- 6. Chromosomal Variation1h 48m
- 7. DNA and Chromosome Structure56m
- 8. DNA Replication1h 10m
- 9. Mitosis and Meiosis1h 34m
- 10. Transcription1h 0m
- 11. Translation58m
- 12. Gene Regulation in Prokaryotes1h 19m
- 13. Gene Regulation in Eukaryotes44m
- 14. Genetic Control of Development44m
- 15. Genomes and Genomics1h 50m
- 16. Transposable Elements47m
- 17. Mutation, Repair, and Recombination1h 6m
- 18. Molecular Genetic Tools19m
- 19. Cancer Genetics29m
- 20. Quantitative Genetics1h 26m
- 21. Population Genetics50m
- 22. Evolutionary Genetics29m
4. Genetic Mapping and Linkage
Mapping Genes
Problem 29d
Textbook Question
A 2006 genetic study of a large American family (Ikeda et al., 2006) identified genetic linkage between DNA markers on chromosome 11 and the gene producing the autosomal dominant neuromuscular disorder spinocerebellar ataxia type 5 (SCA5). The following lod score data are taken from the 2006 study:

Based on available information, is DNA marker B linked to the gene for SCA5? Explain your answer.

1
Understand the concept of a lod score: A lod (logarithm of odds) score is used in genetic linkage analysis to determine whether two loci (e.g., a gene and a DNA marker) are likely to be located near each other on a chromosome. A lod score of 3 or higher is considered evidence of linkage, while a score below 3 suggests no significant linkage.
Examine the lod score data for DNA marker B: The lod scores for DNA marker B at various recombination fractions (θ values) are provided in the problem. These values are 0.35, 0.94, 1.07, 0.99, 0.75, and 0.43.
Compare the lod scores for DNA marker B to the threshold for linkage: Since the threshold for significant linkage is a lod score of 3 or higher, check whether any of the lod scores for DNA marker B meet or exceed this value.
Interpret the results: If none of the lod scores for DNA marker B reach the threshold of 3, this indicates that there is no significant evidence of linkage between DNA marker B and the gene for SCA5. Conversely, if any lod score is 3 or higher, it would suggest linkage.
Conclude based on the data: Based on the lod scores provided for DNA marker B, determine whether the evidence supports or refutes the hypothesis that DNA marker B is linked to the gene for SCA5.

This video solution was recommended by our tutors as helpful for the problem above
Video duration:
3mPlay a video:
Was this helpful?
Key Concepts
Here are the essential concepts you must grasp in order to answer the question correctly.
Genetic Linkage
Genetic linkage refers to the tendency of genes located close to each other on a chromosome to be inherited together during meiosis. This is due to the reduced likelihood of recombination occurring between them. In the context of the question, understanding genetic linkage is crucial for determining whether DNA marker B is associated with the SCA5 gene based on the provided lod score data.
Recommended video:
Guided course
Chi Square and Linkage
Lod Score
A lod score (logarithm of the odds) is a statistical measure used to evaluate the likelihood of genetic linkage between a marker and a trait. A lod score greater than 3 typically indicates significant evidence of linkage, while scores below 0 suggest no linkage. In the study, the lod scores for DNA marker B at various theta values will help assess its potential linkage to the SCA5 gene.
Recommended video:
Guided course
Formation of Plant Gametes
Theta (θ) Value
Theta (θ) value represents the recombination frequency between two genetic loci, indicating the probability that a crossover will occur between them during meiosis. Lower θ values suggest closer proximity and higher linkage, while higher values indicate greater distance and reduced linkage. Analyzing the θ values in conjunction with the lod scores for DNA marker B is essential for determining its relationship with the SCA5 gene.
Recommended video:
Guided course
Step 3
Related Videos
Related Practice
Textbook Question
849
views