The highlighted sequence shown below is the one originally used to produce the B chain of human insulin in E. coli. The sequence of the human gene encoding the B chain of insulin was later determined from a cDNA isolated from a human pancreatic cDNA library and is also shown below, without highlighting. Explain the differences between the two sequences.
ATGTTCGTCAATCAGCACCTTTGTGGTTCTCACCTCGTTGAAGCTTTGTACCTTGTTTGCGGTGAACGTGGTTTCTTCTACACTCCTAAGACTTAA
GCCTTTGTGAACCAACACCTGTGCGGCTCACACCTGGTGGAAGCTCTCTACCTAGTGTGCGGGGAACGAGGCTTCTTCTACACACCCAAGACCCGC
Table of contents
- 1. Introduction to Genetics51m
- 2. Mendel's Laws of Inheritance3h 37m
- 3. Extensions to Mendelian Inheritance2h 41m
- 4. Genetic Mapping and Linkage2h 28m
- 5. Genetics of Bacteria and Viruses1h 21m
- 6. Chromosomal Variation1h 48m
- 7. DNA and Chromosome Structure56m
- 8. DNA Replication1h 10m
- 9. Mitosis and Meiosis1h 34m
- 10. Transcription1h 0m
- 11. Translation58m
- 12. Gene Regulation in Prokaryotes1h 19m
- 13. Gene Regulation in Eukaryotes44m
- 14. Genetic Control of Development44m
- 15. Genomes and Genomics1h 50m
- 16. Transposable Elements47m
- 17. Mutation, Repair, and Recombination1h 6m
- 18. Molecular Genetic Tools19m
- 19. Cancer Genetics29m
- 20. Quantitative Genetics1h 26m
- 21. Population Genetics50m
- 22. Evolutionary Genetics29m
18. Molecular Genetic Tools
Genetic Cloning
Problem 29a
Textbook Question
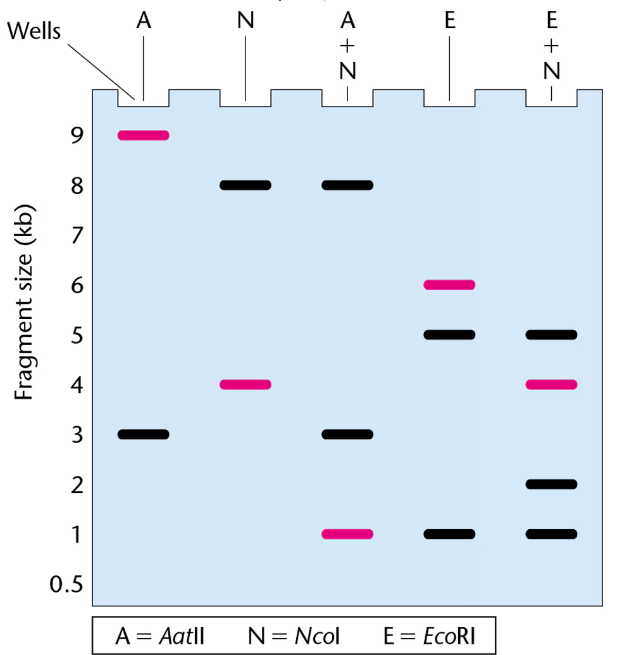
The gel presented here shows the pattern of bands of fragments produced with several restriction enzymes. The enzymes used are identified above the lanes of the gel, and six possible restriction maps are shown in the column to the right.
One of the six restriction maps shown is consistent with the pattern of bands shown in the gel.
From your analysis of the pattern of bands on the gel, select the correct restriction map and explain your reasoning.

 Verified step by step guidance
1
Step 1: Understand the principle behind restriction mapping. Each restriction enzyme cuts DNA at specific sequences, producing fragments of characteristic sizes. When these fragments are run on a gel, they separate by size, creating a pattern of bands.
Step 2: Examine the gel lanes corresponding to each restriction enzyme. Note the number and sizes of the bands in each lane. These sizes represent the lengths of DNA fragments produced by cutting with that enzyme.
Step 3: Compare the observed fragment sizes from the gel with the predicted fragment sizes for each of the six possible restriction maps. For each map, calculate the expected fragment lengths by measuring the distances between restriction sites for each enzyme.
Step 4: Identify which restriction map's predicted fragment sizes match the band pattern on the gel for all enzymes. This map will have fragment sizes that correspond to the observed bands in every lane.
Step 5: Confirm your choice by ensuring that the combined fragment sizes for each enzyme add up to the total length of the DNA molecule, and that the pattern is consistent across all enzymes, supporting the selected restriction map.
 Verified video answer for a similar problem:
This video solution was recommended by our tutors as helpful for the problem above
Video duration:
43sPlay a video:
Was this helpful?
Key Concepts
Here are the essential concepts you must grasp in order to answer the question correctly.
Restriction Enzymes and DNA Fragmentation
Restriction enzymes are proteins that cut DNA at specific sequences, producing fragments of varying lengths. Each enzyme recognizes a unique site, so digesting DNA with different enzymes results in distinct fragment patterns. Understanding how these enzymes cut DNA is essential for interpreting gel electrophoresis results.
Recommended video:
Guided course

Steps to DNA Replication
Gel Electrophoresis and Band Patterns
Gel electrophoresis separates DNA fragments based on size, with smaller fragments migrating faster through the gel matrix. The resulting band pattern reflects the lengths of DNA fragments produced by restriction enzyme digestion. Analyzing these patterns helps infer the arrangement of restriction sites on the DNA.
Recommended video:
Guided course

Segmentation Genes
Restriction Mapping
Restriction mapping involves determining the order and distance between restriction sites on a DNA molecule by analyzing fragment sizes from single and combined enzyme digests. By comparing observed band patterns to predicted fragment sizes, one can deduce the correct restriction map that matches the gel data.
Recommended video:
Guided course

Mapping with Markers
Related Videos
Related Practice
Textbook Question
581
views


