Pearson+ LogoPearson+ Logo
Ch. 3 - Mendelian Genetics
Klug - Essentials of Genetics 10th Edition
Klug10th EditionEssentials of GeneticsISBN: 9780135588789Not the one you use?Change textbook
Chapter 3, Problem 24a

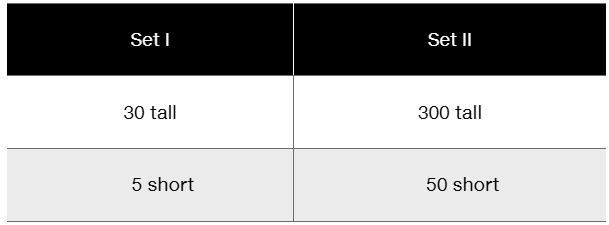
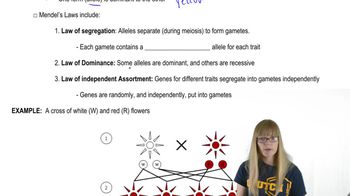
To assess Mendel's law of segregation using tomatoes, a true-breeding tall variety (SS) is crossed with a true-breeding short variety (ss). The heterozygous F₁ tall plants (Ss) were crossed to produce two sets of F₂ data, as follows.
Table comparing two datasets showing counts of tall and short plants: Set I with 30 tall and 5 short, Set II with 300 tall and 50 short.
Using the X² test, analyze the results for both datasets. Calculate X² values and estimate the p values in both cases.

Verified step by step guidance
1
Step 1: Determine the expected phenotypic ratio based on Mendel's law of segregation. Since the F₁ plants are heterozygous (Ss), the expected F₂ phenotypic ratio for tall (S_) to short (ss) plants is 3:1.
Step 2: Calculate the total number of plants in each set. For Set I, total = 30 tall + 5 short = 35 plants. For Set II, total = 300 tall + 50 short = 350 plants.
Step 3: Calculate the expected number of tall and short plants for each set using the 3:1 ratio. Expected tall = (3/4) × total, and expected short = (1/4) × total.
Step 4: Use the chi-square formula to calculate the chi-square (\$X^2\$) value for each set: \[ \chi^2 = \sum \frac{(\text{observed} - \text{expected})^2}{\text{expected}} \] Calculate this separately for tall and short plants and then sum the values.
Step 5: Determine the degrees of freedom (df) for the test, which is the number of phenotypic categories minus 1 (df = 2 - 1 = 1). Use a chi-square distribution table to estimate the p-value for each \$X^2\$ value to assess whether the observed data significantly deviate from the expected 3:1 ratio.

Verified video answer for a similar problem:

This video solution was recommended by our tutors as helpful for the problem above.
Video duration:
3m
Was this helpful?

Key Concepts

Here are the essential concepts you must grasp in order to answer the question correctly.

Mendel's Law of Segregation

Mendel's law of segregation states that allele pairs separate during gamete formation, so each gamete carries only one allele for each gene. In a monohybrid cross of heterozygotes (Ss x Ss), the expected phenotypic ratio is 3:1 (dominant to recessive). This principle explains the inheritance pattern observed in the tall and short tomato plants.
Recommended video:
Guided course
05:48
Mendel's Laws

Chi-Square (X²) Test

The chi-square test is a statistical method used to compare observed data with expected data to determine if deviations are due to chance. It calculates a value based on the sum of squared differences between observed and expected counts, divided by expected counts. This test helps assess if the observed tomato plant ratios fit Mendel's expected 3:1 ratio.
Recommended video:
Guided course
18:27
Chi Square Analysis

p-Value and Statistical Significance

The p-value indicates the probability that the observed deviations from expected results occurred by chance. A low p-value (typically < 0.05) suggests significant deviation, rejecting the null hypothesis. In this context, it helps determine if the tomato plant data supports Mendel's law or if other factors might be influencing the results.
Recommended video:
Guided course
03:08
Drosophila P Element