Here are the essential concepts you must grasp in order to answer the question correctly.
Graph Interpretation
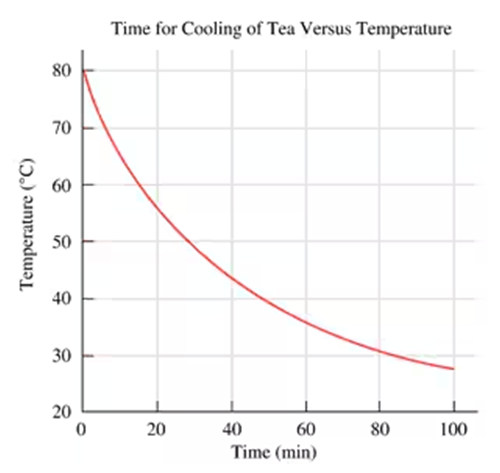
Graph interpretation involves analyzing visual data representations to extract meaningful information. In this context, understanding how to read the axes, identify trends, and determine specific values, such as the time it takes to reach a certain temperature, is crucial for answering the question.
Recommended video:
The Scientific Method Example 2
Temperature vs. Time Relationship
The relationship between temperature and time in this graph illustrates how a liquid's temperature increases as it is heated over time. Recognizing this relationship helps in predicting the time required to reach specific temperatures, such as 45 °C, by observing the curve's progression.
Recommended video:
Logarithmic Relationships
Data Extraction
Data extraction refers to the process of obtaining specific values from a graph. In this case, it involves locating the point where the temperature reaches 45 °C on the graph and tracing it horizontally to find the corresponding time in minutes, which is essential for accurately answering the question.
Recommended video: