Use the following graph for problems1.23 and 1.24: d. How many minutes were needed to reach a temperature of 45 °C?
Verified step by step guidance
1
Identify the y-axis of the graph, which represents the temperature in degrees Celsius (°C).
Locate the temperature of 45 °C on the y-axis.
Draw a horizontal line from the 45 °C mark on the y-axis across the graph until it intersects the curve.
From the point of intersection, draw a vertical line down to the x-axis to determine the corresponding time in minutes.
Read the value on the x-axis where the vertical line meets to find the number of minutes needed to reach 45 °C.
Verified video answer for a similar problem:
This video solution was recommended by our tutors as helpful for the problem above
Video duration:
59s
Play a video:
0 Comments
Key Concepts
Here are the essential concepts you must grasp in order to answer the question correctly.
Graph Interpretation
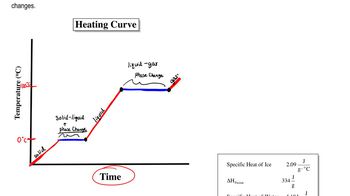
Understanding how to read and interpret graphs is crucial in chemistry. In this case, the graph plots temperature against time, allowing us to visualize how the temperature of a liquid changes as it is heated. By analyzing the graph, we can determine specific values, such as the time it takes to reach a certain temperature.
Temperature is a measure of the average kinetic energy of particles in a substance. In this context, it is important to understand how temperature is measured in degrees Celsius (°C) and how it relates to the heating process of a liquid. Recognizing the significance of temperature changes helps in predicting the behavior of substances under heat.
A heating curve illustrates how the temperature of a substance changes over time as it is heated. It typically shows phases of heating, including periods of constant temperature during phase changes. Understanding heating curves is essential for predicting how long it will take for a substance to reach a specific temperature, as seen in the question regarding the time to reach 45 °C.


 Verified step by step guidance
 00:35
00:35