Join thousands of students who trust us to help them ace their exams!
Multiple Choice
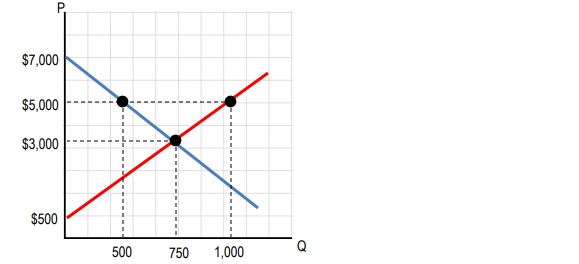
Use the graph for funky-fresh rhymes above. If a shift in demand causes equilibrium price to increase from \$3,000 to \(5,000 per funky-fresh rhyme, what is the change to producer surplus?
A
\$2,250,000 increase
B
\$2,250,000 decrease
C
\$1,312,500 increase
D
\$1,312,500 decrease
1 Comment
Verified step by step guidance
1
Identify the initial and new equilibrium points on the graph. The initial equilibrium price is \$3,000, and the new equilibrium price is \$5,000.
Determine the quantity supplied at both the initial and new equilibrium prices. From the graph, observe the quantity at \$3,000 and \$5,000.
Calculate the initial producer surplus, which is the area of the triangle below the initial equilibrium price and above the supply curve. Use the formula for the area of a triangle: (1/2) * base * height.
Calculate the new producer surplus, which is the area of the triangle below the new equilibrium price and above the supply curve. Again, use the formula for the area of a triangle.
Find the change in producer surplus by subtracting the initial producer surplus from the new producer surplus. This will give you the increase in producer surplus due to the shift in demand.


 Verified step by step guidance
