Ch. 6 - Microbial Growth
Tortora - Microbiology: An Introduction 14th Edition
Tortora14th EditionMicrobiology: An IntroductionISBN: 9780138200398Not the one you use?Change textbook
Chapter 6, Problem 3

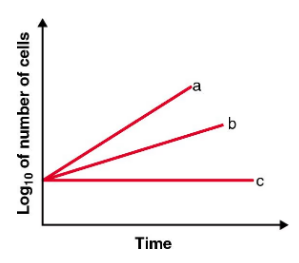
Which of the lines best depicts the log phase of a thermophile incubated at room temperature?
Graph showing three growth curves labeled a, b, and c plotting log number of cells versus time.

Verified step by step guidance
1
Step 1: Understand the growth phases of bacteria, including the lag phase, log (exponential) phase, stationary phase, and death phase. The log phase is characterized by rapid, exponential growth where the number of cells increases logarithmically over time.
Step 2: Recognize that thermophiles are microorganisms that thrive at high temperatures, typically above 45°C, and their optimal growth is not at room temperature (around 20-25°C). At room temperature, thermophiles will grow very slowly or not at all.
Step 3: Analyze the graph where the y-axis is the log10 of the number of cells and the x-axis is time. Line 'a' shows the steepest increase, indicating rapid growth; line 'b' shows moderate growth; line 'c' is flat, indicating no growth.
Step 4: Since the thermophile is incubated at room temperature, it will not grow rapidly. Therefore, the line that best depicts the log phase under these suboptimal conditions would be the one showing slow or no growth.
Step 5: Conclude that line 'c', which is flat and shows no increase in cell number over time, best represents the log phase of a thermophile incubated at room temperature because the cells are not actively dividing.

Verified video answer for a similar problem:

This video solution was recommended by our tutors as helpful for the problem above.
Video duration:
2m
Was this helpful?

Key Concepts

Here are the essential concepts you must grasp in order to answer the question correctly.

Microbial Growth Phases

Microbial growth typically follows distinct phases: lag, log (exponential), stationary, and death. The log phase is characterized by rapid cell division and exponential increase in cell number, shown as a steep upward slope on a growth curve.
Recommended video:
Guided course
08:59
Microbial Growth Curves in a Closed System

Thermophiles and Temperature Effects

Thermophiles are microorganisms that thrive at high temperatures, usually between 45°C and 80°C. Incubating thermophiles at room temperature (around 20-25°C) slows or inhibits their growth, often resulting in a reduced or absent log phase.
Recommended video:
Guided course
04:56
Classification of Microbes by Growth Temperature

Interpreting Growth Curves

Growth curves plot the logarithm of cell number against time to visualize microbial population changes. A steep upward line indicates active growth (log phase), a flat line indicates no growth, and a less steep slope suggests slower growth rates.
Recommended video:
Guided course
08:59
Microbial Growth Curves in a Closed System