
 06:59
06:59
Textbook Question
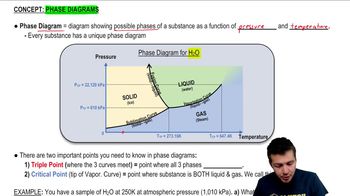
Solid water (ice) is slowly warmed from a very low temperature. What minimum external pressure must be applied to the solid if a melting phase transition is to be observed? Describe the sequence of phase transitions that occur if the applied pressure is such that .
1012
views