Write a short description of the motion of a real object for which FIGURE EX1.20 would be a realistic position-versus-time graph.
Verified step by step guidance
1
Analyze the position-versus-time graph in FIGURE EX1.20. Typically, such graphs depict how the position of an object changes over time, with position on the vertical axis and time on the horizontal axis.
Identify the shape of the graph. For example, if the graph is a straight line, it indicates uniform motion (constant velocity). If the graph is curved, it suggests acceleration or deceleration.
Consider real-world scenarios that match the graph's characteristics. For instance, a straight line graph could represent a car moving at a constant speed, while a parabolic curve might represent a ball thrown into the air and falling back down.
Describe the motion of the object based on the graph. For example, if the graph shows a curve that levels off, it could represent an object slowing down as it approaches a stop.
Ensure the description is realistic and matches the graph's features. For example, if the graph shows oscillatory motion, it could represent a pendulum or a mass on a spring.
Verified video answer for a similar problem:
This video solution was recommended by our tutors as helpful for the problem above
Video duration:
7m
Play a video:
0 Comments
Key Concepts
Here are the essential concepts you must grasp in order to answer the question correctly.
Position vs. Time Graphs
Position vs. time graphs visually represent the location of an object over time. The x-axis typically denotes time, while the y-axis indicates position. The slope of the graph indicates the object's velocity, with a steeper slope representing higher speeds. Understanding how to interpret these graphs is crucial for analyzing motion.
Motion can be categorized into various types, such as uniform motion, accelerated motion, and oscillatory motion. Uniform motion occurs when an object moves at a constant speed in a straight line, while accelerated motion involves a change in speed or direction. Recognizing the type of motion depicted in a graph helps in accurately describing the object's behavior.
Velocity is a vector quantity that describes the rate of change of an object's position, including both speed and direction. Acceleration, on the other hand, is the rate of change of velocity over time. Understanding these concepts is essential for interpreting the dynamics of motion represented in position vs. time graphs, as they provide insights into how an object's speed and direction change.


 Verified step by step guidance
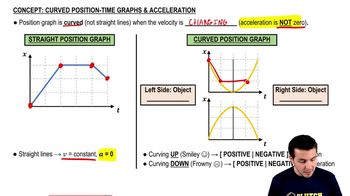
 03:04
03:04
