Skip to main content
Physics
My Course
Learn
Exam Prep
AI Tutor
Study Guides
Textbook Solutions
Flashcards
Explore
Try the app
My Course
Learn
Exam Prep
AI Tutor
Study Guides
Textbook Solutions
Flashcards
Explore
Try the app
Back
Graphing Position, Velocity, and Acceleration Graphs quiz
You can tap to flip the card.
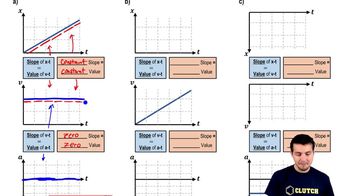
What is the relationship between position, velocity, and acceleration graphs?
You can tap to flip the card.
👆
What is the relationship between position, velocity, and acceleration graphs?
The slope of the position-time graph represents velocity, and the slope of the velocity-time graph indicates acceleration.
Track progress
Control buttons has been changed to "navigation" mode.
1/24
Related flashcards
Related practice
Recommended videos
Graphing Position, Velocity, and Acceleration Graphs definitions
Graphing Position, Velocity, and Acceleration Graphs
15 Terms
Graphing Position, Velocity, and Acceleration Graphs quiz #1
Graphing Position, Velocity, and Acceleration Graphs
12 Terms
Graphing Position, Velocity, and Acceleration Graphs
2. 1D Motion / Kinematics
2 problems
Topic
Emilee
2. 1D Motion / Kinematics - Part 1 of 2
7 topics
14 problems
Chapter
Patrick
2. 1D Motion / Kinematics - Part 2 of 2
5 topics
11 problems
Chapter
Patrick
Guided course
07:32
Graphing Position, Velocity, and Acceleration Graphs
11609
views
180
rank
4
comments
Guided course
03:35
Graph Velocity and Acceleration
7473
views
198
rank
3
comments
Terms in this set (24)
Hide definitions
What is the relationship between position, velocity, and acceleration graphs?
The slope of the position-time graph represents velocity, and the slope of the velocity-time graph indicates acceleration.
What does a position-time graph with a constant slope indicate?
A position-time graph with a constant slope indicates constant velocity.
How can you determine acceleration from a velocity-time graph?
The slope of the velocity-time graph gives the value of acceleration.
What information is typically presented on the y-axis of a velocity-time graph?
The y-axis of a velocity-time graph typically represents velocity.
What does a velocity-time graph with a constant slope indicate?
A velocity-time graph with a constant slope indicates constant acceleration.
What does a curved position-time graph represent in terms of velocity?
A curved position-time graph represents changing velocity, indicating acceleration.
How would you identify the independent variable within a motion graph?
The independent variable, such as time, is typically plotted on the x-axis.
What does a flat line on a velocity-time graph indicate about acceleration?
A flat line on a velocity-time graph indicates zero acceleration.
What does a downward sloping velocity-time graph indicate about acceleration?
A downward sloping velocity-time graph indicates negative acceleration.
What does a flat line on a position-time graph indicate about velocity?
A flat line on a position-time graph indicates zero velocity.
Which is correct about variables plotted on a line graph for motion?
Time is typically the independent variable on the x-axis, while position, velocity, or acceleration is on the y-axis.
What are the points where a position-time graph changes from increasing to decreasing slope called?
These points are called inflection points.
The independent variable (test variable) is located on which axis in a motion graph?
The independent variable is located on the x-axis.
Which type of chart plots the relationship between dependent and independent variables in motion?
A line graph is used to plot the relationship between dependent and independent variables in motion.
What information is presented on the y-axis of an acceleration-time graph?
The y-axis of an acceleration-time graph represents acceleration.
Considering a graph with a constant positive slope, what can be inferred about velocity?
A constant positive slope on a position-time graph indicates constant positive velocity.
According to a graph with a decreasing slope, what can be inferred about acceleration?
A decreasing slope on a velocity-time graph indicates negative acceleration.
The slope of the graph of the equation y = 2x - 2 is 2. What is the y-intercept?
The y-intercept is -2.
What type of growth is displayed in a position-time graph with an increasing slope?
An increasing slope in a position-time graph indicates accelerating growth.
Do the results in a velocity-time graph with a constant slope support the hypothesis of constant acceleration?
Yes, a constant slope in a velocity-time graph supports the hypothesis of constant acceleration.
Which of these graphs shows the correct labels for the independent and dependent variables in motion?
A graph with time on the x-axis and position, velocity, or acceleration on the y-axis shows correct labels.
What is the best explanation for the curve’s shape in a position-time graph with changing slope?
The curve's shape indicates changing velocity, suggesting acceleration is present.
Is the following statement supported or not supported by the data shown in a velocity-time graph with a flat line?
Supported; a flat line indicates zero acceleration.
Which type of graph should be used when plotting scientific data involving motion?
A line graph should be used to plot scientific data involving motion.
 BackBack

 07:32
07:32