Skip to main content
Precalculus
My Course
Learn
Exam Prep
AI Tutor
Study Guides
Flashcards
Explore
Try the app
My Course
Learn
Exam Prep
AI Tutor
Study Guides
Flashcards
Explore
Try the app
Back
Graphing Systems of Inequalities definitions
You can tap to flip the card.
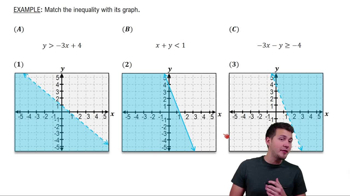
Inequality
You can tap to flip the card.
👆
Inequality
A mathematical statement comparing two expressions using symbols like <, >, ≤, or ≥, indicating a range of possible solutions.
Track progress
Control buttons has been changed to "navigation" mode.
1/15
Related flashcards
Related practice
Recommended videos
Graphing Systems of Inequalities quiz
Graphing Systems of Inequalities
15 Terms
Graphing Systems of Inequalities
18. Systems of Equations and Matrices
6 problems
Topic
Determinants and Cramer's Rule
18. Systems of Equations and Matrices
6 problems
Topic
18. Systems of Equations and Matrices
4 topics
10 problems
Chapter
Guided course
6:19
Systems of Inequalities
292
views
3
rank
Guided course
3:55
Example 1
370
views
6
rank
Guided course
4:37
Example 2
244
views
3
rank
Terms in this set (15)
Hide definitions
Inequality
A mathematical statement comparing two expressions using symbols like <, >, ≤, or ≥, indicating a range of possible solutions.
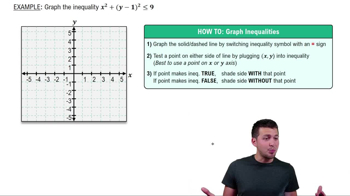
Solid Line
A boundary on a graph drawn when the inequality includes equality (≤ or ≥), showing points on the line are included in the solution.
Dashed Line
A boundary on a graph drawn when the inequality excludes equality (< or >), showing points on the line are not included in the solution.
Test Point
A coordinate selected and substituted into an inequality to determine which side of a boundary should be shaded.
Shaded Region
The area on a graph representing all points that satisfy a given inequality or system of inequalities.
System of Inequalities
A set of two or more inequalities graphed on the same coordinate plane, with solutions found in overlapping shaded regions.
Overlapping Region
The area where shaded regions from multiple inequalities intersect, representing solutions that satisfy all inequalities.
Slope-Intercept Form
An equation format y = mx + b, making it easier to graph lines and determine shading for inequalities.
Parabola
A U-shaped curve on a graph, typically representing quadratic equations, used as a boundary in nonlinear inequalities.
Vertex
The turning point of a parabola, indicating the minimum or maximum value of a quadratic boundary.
Boundary
A line or curve on a graph that separates regions where an inequality is true from where it is false.
Linear Inequality
An inequality involving a linear equation, resulting in a straight boundary line on a graph.
Nonlinear Inequality
An inequality involving a nonlinear equation, such as a quadratic, resulting in a curved boundary on a graph.
Solution Region
The set of all points on a graph that satisfy every inequality in a system, often found by overlapping shaded areas.
Y-Intercept
The point where a graph crosses the y-axis, often used as a starting point for graphing lines and curves.
 BackBack
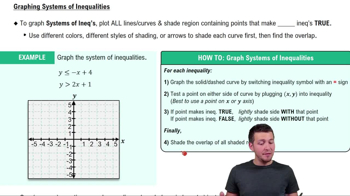
 6:19
6:19