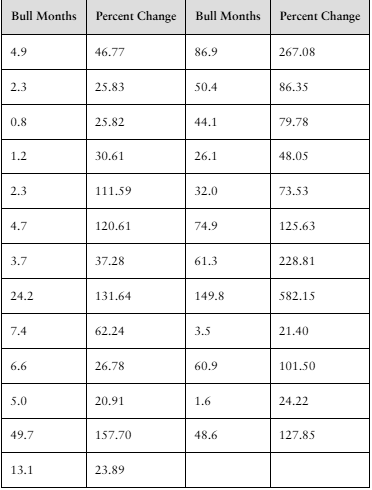
Using the sample data below, create a confidence interval for to see if there is evidence that there is a positive correlation between and with .
Table of contents
- 1. Intro to Stats and Collecting Data1h 14m
- 2. Describing Data with Tables and Graphs1h 56m
- 3. Describing Data Numerically2h 5m
- 4. Probability2h 17m
- 5. Binomial Distribution & Discrete Random Variables3h 6m
- 6. Normal Distribution and Continuous Random Variables2h 11m
- 7. Sampling Distributions & Confidence Intervals: Mean3h 23m
- Sampling Distribution of the Sample Mean and Central Limit Theorem19m
- Distribution of Sample Mean - ExcelBonus23m
- Introduction to Confidence Intervals15m
- Confidence Intervals for Population Mean1h 18m
- Determining the Minimum Sample Size Required12m
- Finding Probabilities and T Critical Values - ExcelBonus28m
- Confidence Intervals for Population Means - ExcelBonus25m
- 8. Sampling Distributions & Confidence Intervals: Proportion2h 10m
- 9. Hypothesis Testing for One Sample5h 8m
- Steps in Hypothesis Testing1h 6m
- Performing Hypothesis Tests: Means1h 4m
- Hypothesis Testing: Means - ExcelBonus42m
- Performing Hypothesis Tests: Proportions37m
- Hypothesis Testing: Proportions - ExcelBonus27m
- Performing Hypothesis Tests: Variance12m
- Critical Values and Rejection Regions28m
- Link Between Confidence Intervals and Hypothesis Testing12m
- Type I & Type II Errors16m
- 10. Hypothesis Testing for Two Samples5h 37m
- Two Proportions1h 13m
- Two Proportions Hypothesis Test - ExcelBonus28m
- Two Means - Unknown, Unequal Variance1h 3m
- Two Means - Unknown Variances Hypothesis Test - ExcelBonus12m
- Two Means - Unknown, Equal Variance15m
- Two Means - Unknown, Equal Variances Hypothesis Test - ExcelBonus9m
- Two Means - Known Variance12m
- Two Means - Sigma Known Hypothesis Test - ExcelBonus21m
- Two Means - Matched Pairs (Dependent Samples)42m
- Matched Pairs Hypothesis Test - ExcelBonus12m
- Two Variances and F Distribution29m
- Two Variances - Graphing CalculatorBonus16m
- 11. Correlation1h 24m
- 12. Regression3h 33m
- Linear Regression & Least Squares Method26m
- Residuals12m
- Coefficient of Determination12m
- Regression Line Equation and Coefficient of Determination - ExcelBonus8m
- Finding Residuals and Creating Residual Plots - ExcelBonus11m
- Inferences for Slope31m
- Enabling Data Analysis ToolpakBonus1m
- Regression Readout of the Data Analysis Toolpak - ExcelBonus21m
- Prediction Intervals13m
- Prediction Intervals - ExcelBonus19m
- Multiple Regression - ExcelBonus29m
- Quadratic Regression15m
- Quadratic Regression - ExcelBonus10m
- 13. Chi-Square Tests & Goodness of Fit2h 21m
- 14. ANOVA2h 29m
12. Regression
Inferences for Slope
Problem 8.1.44e
Textbook Question
Bull Markets A bull market is defined as a market condition in which the price of a security rises for an extended period of time. A bull market in the stock market is often defined as a condition in which a market rises by 20% or more without a 20% decline. The data to the right represent the number of months and percentage change in the S&P 500 (a group of 500 stocks) during the 25 bull markets dating back to 1929 (the year of the famous market crash).
e. Interpret the slope.

Verified step by step guidance1
Step 1: Understand the context of the problem. The data shows the relationship between the number of months a bull market lasts (Bull Months) and the percentage change in the S&P 500 during that period (Percent Change). The goal is to interpret the slope of the regression line that models this relationship.
Step 2: Recall the meaning of the slope in a linear regression context. The slope represents the average change in the dependent variable (Percent Change) for each one-unit increase in the independent variable (Bull Months).
Step 3: Identify the variables: here, 'Bull Months' is the independent variable (x), and 'Percent Change' is the dependent variable (y). The slope tells us how much the Percent Change in the S&P 500 is expected to increase for each additional month of a bull market.
Step 4: Formulate the interpretation of the slope. For example, if the slope is positive, it means that longer bull markets tend to be associated with larger percentage increases in the S&P 500. The exact value of the slope quantifies this increase per month.
Step 5: Summarize the interpretation clearly: The slope indicates the average increase in the S&P 500's percent change for each additional month that the bull market lasts, reflecting the strength and duration relationship of bull markets.
Verified video answer for a similar problem:This video solution was recommended by our tutors as helpful for the problem above
Video duration:
2mPlay a video:
0 Comments
Key Concepts
Here are the essential concepts you must grasp in order to answer the question correctly.
Slope in Linear Regression
The slope represents the rate of change between two variables in a linear relationship. In this context, it indicates how much the percent change in the S&P 500 increases for each additional month in a bull market. A positive slope means longer bull markets tend to have higher percent gains.
Recommended video:
Guided course
Intro to Least Squares Regression
Interpretation of Scatterplot Data
Scatterplots display the relationship between two quantitative variables, here bull months and percent change. Understanding the pattern, direction, and strength of the data points helps interpret the slope and overall trend, showing how the length of bull markets relates to market gains.
Recommended video:
Guided course
Scatterplots & Intro to Correlation
Definition and Characteristics of Bull Markets
A bull market is a period when stock prices rise significantly, typically by 20% or more without a 20% decline. Knowing this helps contextualize the data, as the percent changes and durations reflect sustained positive market trends, which are essential for interpreting the statistical relationship.
Recommended video:
Guided course
Parameters vs. Statistics
Related Videos
Related Practice
Multiple Choice
31
views
