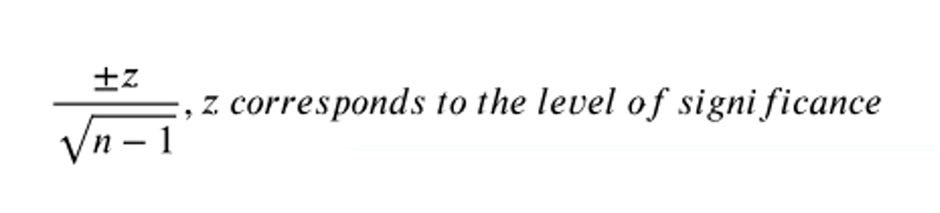
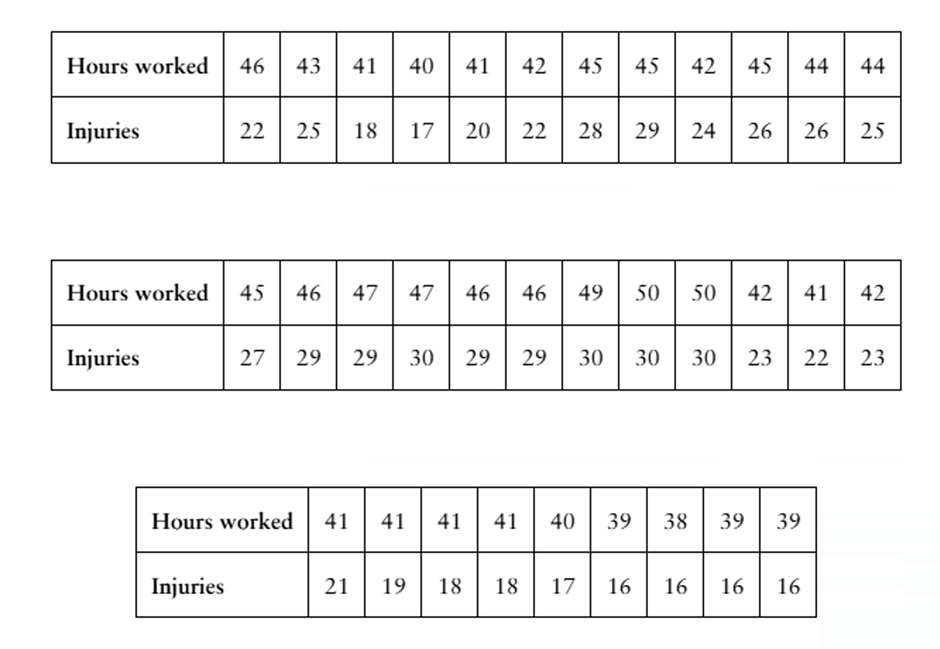
Testing the Spearman Rank Correlation Coefficient for n>30 When you are testing the significance of the Spearman rank correlation coefficient and the sample size n is greater than 30, you can use the expression below to find the critical value. In Exercises 13 and 14, test the Spearman rank correlation coefficient [APPLET] Work Injuries The table shows the average hours worked per week and the numbers of on-the-job injuries for a random sample of U.S. companies in a recent year. At α = =0.10, can you conclude that there is a significant correlation between average hours worked and the number of on-the-job injuries?
Verified step by step guidance
1
Step 1: Rank the data for both variables (Hours Worked and Injuries) separately. Assign ranks to each value, with the smallest value receiving rank 1. If there are tied values, assign the average rank to those values.
Step 2: Calculate the difference (d) between the ranks of Hours Worked and Injuries for each pair of data points. Then, square these differences to obtain d².
Step 3: Compute the Spearman rank correlation coefficient (r_s) using the formula: , where n is the number of data pairs.
Step 4: Determine the critical value for the Spearman rank correlation coefficient using the formula: , where z corresponds to the significance level (α = 0.10 in this case) and n is the sample size.
Step 5: Compare the calculated r_s value with the critical value. If the absolute value of r_s is greater than the critical value, reject the null hypothesis and conclude that there is a significant correlation between Hours Worked and Injuries. Otherwise, fail to reject the null hypothesis.
Verified video answer for a similar problem:
This video solution was recommended by our tutors as helpful for the problem above
Video duration:
3m
Play a video:
0 Comments
Key Concepts
Here are the essential concepts you must grasp in order to answer the question correctly.
Spearman Rank Correlation Coefficient
The Spearman Rank Correlation Coefficient is a non-parametric measure of correlation that assesses how well the relationship between two variables can be described using a monotonic function. It ranks the data points and calculates the correlation based on these ranks, making it suitable for ordinal data or non-normally distributed interval data.
The critical value is a threshold that determines whether to reject the null hypothesis in hypothesis testing. For the Spearman rank correlation, the critical value is derived from the distribution of the test statistic, which depends on the sample size and the chosen significance level (α). If the calculated correlation coefficient exceeds the critical value, the correlation is considered statistically significant.
The significance level, denoted as α, is the probability of rejecting the null hypothesis when it is actually true (Type I error). Commonly set at 0.05 or 0.10, it defines the threshold for determining statistical significance in hypothesis testing. In this context, a significance level of 0.10 indicates a 10% risk of concluding that a correlation exists when there is none.

 Verified step by step guidance
 05:43
05:43
