4. Probability
Counting
Problem 5.5.52
Textbook Question
Simple Random Sample How many different simple random samples of size 7 can be obtained from a population whose size is 100?
 Verified step by step guidance
1
Identify the problem as a combination problem because the order of selection does not matter in a simple random sample.
Recall the formula for combinations, which is used to find the number of ways to choose \(k\) items from \(n\) items without regard to order:
\[ C(n, k) = \frac{n!}{k! (n-k)!} \]
Substitute the given values into the formula: here, \(n = 100\) (population size) and \(k = 7\) (sample size). So, the expression becomes
\[ C(100, 7) = \frac{100!}{7! (100-7)!} \]
Understand that \$100!\( (100 factorial) means the product of all positive integers from 1 to 100, and similarly for \)7!\( and \)93!$; these factorials can be simplified to make calculation easier.
Use a calculator or software capable of handling large factorials to compute the value of \(C(100, 7)\), which will give the total number of different simple random samples of size 7 from a population of 100.
Verified video answer for a similar problem:This video solution was recommended by our tutors as helpful for the problem above
Video duration:
3mKey Concepts
Here are the essential concepts you must grasp in order to answer the question correctly.
Simple Random Sample
A simple random sample is a subset of individuals chosen from a larger population where each member has an equal chance of being selected. This method ensures unbiased representation and is fundamental for valid statistical inference.
Recommended video:

 04:17
04:17Simple Random Sampling
Combination Formula
The combination formula calculates the number of ways to choose a subset of items from a larger set without regard to order. It is given by nCr = n! / [r!(n - r)!], where n is the population size and r is the sample size.
Recommended video:
 05:22
05:22Combinations
Factorial Notation
Factorial notation (n!) represents the product of all positive integers up to n. It is essential for computing combinations and permutations, as it helps quantify the total arrangements or selections possible.
Recommended video:
 07:11
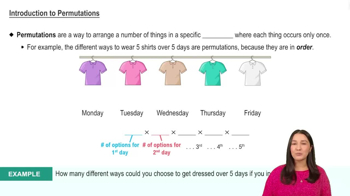
07:11Introduction to Permutations

Related Videos
0