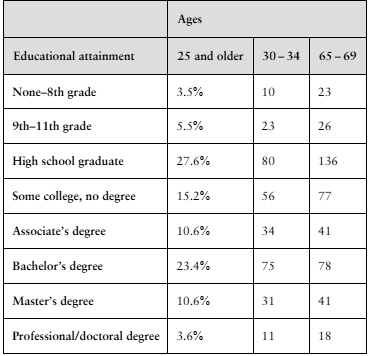
In Exercises 1 and 2, use the table, which lists the distribution of educational achievement for people in the United States ages 25 and older. It also lists the results of a random survey for two additional age groups. (Adapted from U.S. Census Bureau)
Use the data for 30- to 34-year-olds and 65- to 69-year-olds to test whether age and educational attainment are related. Use α=0.01.
Verified step by step guidance
1
Step 1: Define the null hypothesis (H₀) and the alternative hypothesis (H₁). H₀: Age and educational attainment are independent. H₁: Age and educational attainment are related.
Step 2: Organize the data into a contingency table. Use the given data for the two age groups (30–34 and 65–69) and the educational attainment categories.
Step 3: Calculate the expected frequencies for each cell in the contingency table using the formula: E = (row total × column total) / grand total. This ensures the expected frequencies align with the assumption of independence.
Step 4: Compute the test statistic using the chi-square formula: χ² = Σ((O - E)² / E), where O represents the observed frequency and E represents the expected frequency for each cell.
Step 5: Compare the calculated χ² value to the critical value from the chi-square distribution table at α = 0.01 with the appropriate degrees of freedom (df = (number of rows - 1) × (number of columns - 1)). If χ² > critical value, reject H₀; otherwise, fail to reject H₀.
Verified video answer for a similar problem:
This video solution was recommended by our tutors as helpful for the problem above
Video duration:
3m
Play a video:
0 Comments
Key Concepts
Here are the essential concepts you must grasp in order to answer the question correctly.
Test Statistic
A test statistic is a standardized value that is calculated from sample data during a hypothesis test. It measures how far the sample statistic is from the null hypothesis, expressed in terms of standard errors. Common test statistics include the z-score and t-score, which help determine whether to reject the null hypothesis based on the significance level.
Hypothesis testing is a statistical method used to make decisions about a population based on sample data. It involves formulating a null hypothesis (H0) and an alternative hypothesis (H1), then using sample data to determine the likelihood of observing the data if the null hypothesis is true. A significance level (α) is set to decide whether to reject H0.
The Chi-Square Test of Independence is a statistical test used to determine if there is a significant association between two categorical variables. It compares the observed frequencies in each category to the frequencies expected under the assumption of independence. A significant result indicates that the variables are related, which is relevant for analyzing educational attainment across different age groups.

 Verified step by step guidance
 06:34
06:34
