

 05:54
05:54


Textbook Question
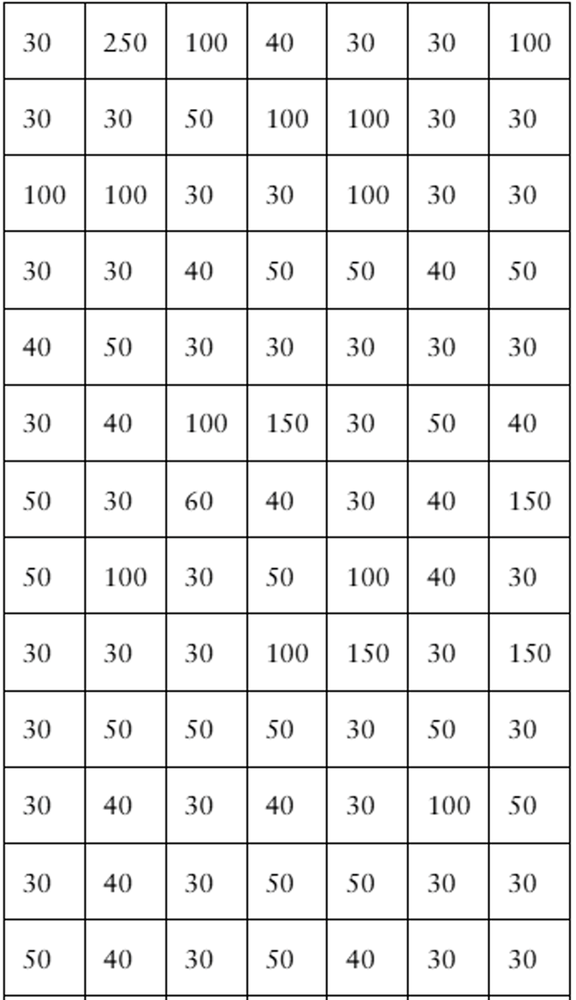
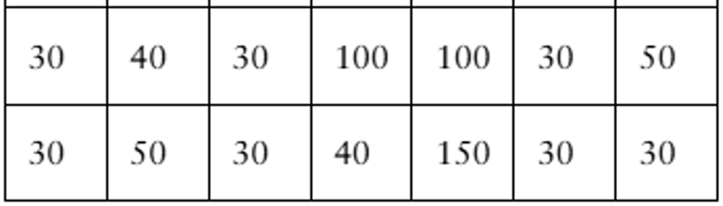
In Exercises 21–24, a control chart is shown. Each chart has horizontal lines drawn at the mean mu, at mu ±2sigma, and at mu±3sigma. Determine whether the process shown is in control or out of control. Explain.
An engine part has been designed to have a diameter of 55 millimeters. The standard deviation of the process is 0.001 millimeter.
52
views