

 06:23
06:23


Textbook Question
Comparing Waiting Lines
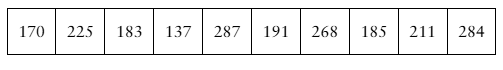
The values listed below are waiting times (in minutes) of customers at the Jefferson Valley Bank, where customers enter a single waiting line that feeds three teller windows. Construct a 95% confidence interval for the population standard deviation sigma.
127
views