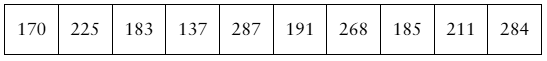
You wish to estimate the mean winning time for Boston Marathon Women’s Open Division champions. The estimate must be within 2 minutes of the population mean. Determine the minimum sample size required to construct a 99% confidence interval for the population mean. Use the population standard deviation from Exercise 1.
Table of contents
- 1. Intro to Stats and Collecting Data55m
- 2. Describing Data with Tables and Graphs1h 55m
- 3. Describing Data Numerically1h 45m
- 4. Probability2h 16m
- 5. Binomial Distribution & Discrete Random Variables2h 33m
- 6. Normal Distribution and Continuous Random Variables1h 38m
- 7. Sampling Distributions & Confidence Intervals: Mean1h 53m
- 8. Sampling Distributions & Confidence Intervals: Proportion1h 12m
- 9. Hypothesis Testing for One Sample2h 19m
- 10. Hypothesis Testing for Two Samples3h 22m
- 11. Correlation1h 6m
- 12. Regression1h 4m
- 13. Chi-Square Tests & Goodness of Fit1h 20m
- 14. ANOVA1h 0m
7. Sampling Distributions & Confidence Intervals: Mean
Confidence Intervals for Population Mean
Problem 6.T.2b
Textbook Question
The data set represents the weights (in pounds) of 10 randomly selected black bears from northeast Pennsylvania. Assume the weights are normally distributed. (Source: Pennsylvania Game Commission)

b. Construct a 95% confidence interval for the population mean. Interpret the results.

1
Step 1: Calculate the sample mean (x̄) by summing all the weights in the data set and dividing by the number of observations (n = 10). Use the formula: .
Step 2: Calculate the sample standard deviation (s) using the formula: . This involves finding the squared differences between each weight and the sample mean, summing them, dividing by (n-1), and taking the square root.
Step 3: Determine the critical value (t*) for a 95% confidence interval using a t-distribution table. Since the sample size is 10, the degrees of freedom (df) will be n-1 = 9. Look up the t* value corresponding to df = 9 and a 95% confidence level.
Step 4: Calculate the margin of error (E) using the formula: . Plug in the values for t*, s, and n.
Step 5: Construct the confidence interval for the population mean using the formula: . Interpret the results by explaining that the interval provides a range of plausible values for the population mean weight of black bears with 95% confidence.

This video solution was recommended by our tutors as helpful for the problem above
Video duration:
8mPlay a video:
Was this helpful?
Key Concepts
Here are the essential concepts you must grasp in order to answer the question correctly.
Normal Distribution
Normal distribution is a probability distribution that is symmetric about the mean, showing that data near the mean are more frequent in occurrence than data far from the mean. It is characterized by its bell-shaped curve, defined by its mean and standard deviation. In this context, assuming the weights of the bears are normally distributed allows for the application of statistical methods, such as confidence intervals.
Recommended video:
Using the Normal Distribution to Approximate Binomial Probabilities
Confidence Interval
A confidence interval is a range of values, derived from sample statistics, that is likely to contain the value of an unknown population parameter. For a 95% confidence interval, we can say that if we were to take many samples and build intervals, approximately 95% of those intervals would contain the true population mean. This concept is crucial for estimating the mean weight of the bear population based on the sample data.
Recommended video:
Introduction to Confidence Intervals
Sample Mean and Standard Deviation
The sample mean is the average of a set of values, calculated by summing all the observations and dividing by the number of observations. The standard deviation measures the amount of variation or dispersion in a set of values. In constructing a confidence interval, both the sample mean and standard deviation are used to determine the range within which the population mean is likely to fall.
Recommended video:
Guided course
Calculating Standard Deviation
Watch next
Master Population Standard Deviation Known with a bite sized video explanation from Patrick
Start learningRelated Videos
Related Practice
Textbook Question
18
views