In Exercises 5–16, use analysis of variance for the indicated test.
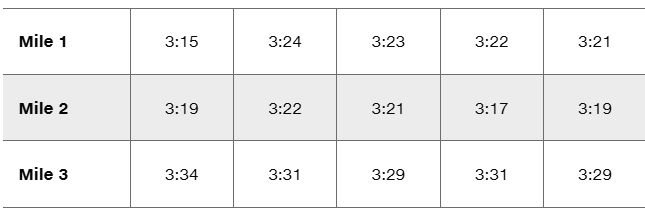
Triathlon Times Jeff Parent is a statistics instructor who participates in triathlons. Listed below are times (in minutes and seconds) he recorded while riding a bicycle for five stages through each mile of a 3-mile loop. Use a 0.05 significance level to test the claim that it takes the same time to ride each of the miles. Does one of the miles appear to have a hill?
Verified step by step guidance
1
Step 1: Convert the times into a consistent numerical format (e.g., seconds). For example, 3:15 becomes 195 seconds, 3:24 becomes 204 seconds, and so on. This ensures all data is in a comparable format for analysis.
Step 2: Organize the data into groups based on the miles (Mile 1, Mile 2, Mile 3). Calculate the mean and variance for each group to summarize the data.
Step 3: Perform an Analysis of Variance (ANOVA) test. The null hypothesis (H0) is that the mean times for all three miles are equal, while the alternative hypothesis (H1) is that at least one mile has a different mean time. Use the formula for the F-statistic: F = (Between-group variance) / (Within-group variance).
Step 4: Compare the calculated F-statistic to the critical value from the F-distribution table at a significance level of 0.05. If the F-statistic exceeds the critical value, reject the null hypothesis.
Step 5: Interpret the results. If the null hypothesis is rejected, identify which mile has the significantly different mean time. This could indicate the presence of a hill or other factor affecting the time for that mile.
Verified video answer for a similar problem:
This video solution was recommended by our tutors as helpful for the problem above
Video duration:
3m
Play a video:
0 Comments
Key Concepts
Here are the essential concepts you must grasp in order to answer the question correctly.
Analysis of Variance (ANOVA)
ANOVA is a statistical method used to compare the means of three or more groups to determine if at least one group mean is significantly different from the others. It helps in assessing the impact of one or more factors by comparing the variance within groups to the variance between groups. In this case, it will be used to test if the average times for each mile differ significantly.
Variance & Standard Deviation of Discrete Random Variables
Significance Level
The significance level, often denoted as alpha (α), is the threshold for determining whether a result is statistically significant. A common significance level is 0.05, which indicates a 5% risk of concluding that a difference exists when there is none. In this exercise, using a 0.05 significance level means that if the p-value from the ANOVA test is less than 0.05, we reject the null hypothesis that all mile times are equal.
In hypothesis testing, the null hypothesis (H0) represents a statement of no effect or no difference, while the alternative hypothesis (H1) suggests that there is an effect or a difference. For this question, the null hypothesis would state that the mean times for all three miles are equal, while the alternative hypothesis would suggest that at least one mile has a different mean time, potentially indicating the presence of a hill.

 Verified step by step guidance
 04:48
04:48
