Table of contents
- 1. Intro to Stats and Collecting Data1h 14m
- 2. Describing Data with Tables and Graphs1h 56m
- 3. Describing Data Numerically2h 5m
- 4. Probability2h 16m
- 5. Binomial Distribution & Discrete Random Variables3h 6m
- 6. Normal Distribution and Continuous Random Variables2h 11m
- 7. Sampling Distributions & Confidence Intervals: Mean3h 23m
- Sampling Distribution of the Sample Mean and Central Limit Theorem19m
- Distribution of Sample Mean - Excel23m
- Introduction to Confidence Intervals15m
- Confidence Intervals for Population Mean1h 18m
- Determining the Minimum Sample Size Required12m
- Finding Probabilities and T Critical Values - Excel28m
- Confidence Intervals for Population Means - Excel25m
- 8. Sampling Distributions & Confidence Intervals: Proportion2h 10m
- 9. Hypothesis Testing for One Sample5h 8m
- Steps in Hypothesis Testing1h 6m
- Performing Hypothesis Tests: Means1h 4m
- Hypothesis Testing: Means - Excel42m
- Performing Hypothesis Tests: Proportions37m
- Hypothesis Testing: Proportions - Excel27m
- Performing Hypothesis Tests: Variance12m
- Critical Values and Rejection Regions28m
- Link Between Confidence Intervals and Hypothesis Testing12m
- Type I & Type II Errors16m
- 10. Hypothesis Testing for Two Samples5h 37m
- Two Proportions1h 13m
- Two Proportions Hypothesis Test - Excel28m
- Two Means - Unknown, Unequal Variance1h 3m
- Two Means - Unknown Variances Hypothesis Test - Excel12m
- Two Means - Unknown, Equal Variance15m
- Two Means - Unknown, Equal Variances Hypothesis Test - Excel9m
- Two Means - Known Variance12m
- Two Means - Sigma Known Hypothesis Test - Excel21m
- Two Means - Matched Pairs (Dependent Samples)42m
- Matched Pairs Hypothesis Test - Excel12m
- Two Variances and F Distribution29m
- Two Variances - Graphing Calculator16m
- 11. Correlation1h 24m
- 12. Regression3h 33m
- Linear Regression & Least Squares Method26m
- Residuals12m
- Coefficient of Determination12m
- Regression Line Equation and Coefficient of Determination - Excel8m
- Finding Residuals and Creating Residual Plots - Excel11m
- Inferences for Slope31m
- Enabling Data Analysis Toolpak1m
- Regression Readout of the Data Analysis Toolpak - Excel21m
- Prediction Intervals13m
- Prediction Intervals - Excel19m
- Multiple Regression - Excel29m
- Quadratic Regression15m
- Quadratic Regression - Excel10m
- 13. Chi-Square Tests & Goodness of Fit2h 21m
- 14. ANOVA2h 28m
12. Regression
Residuals
Problem 9.3.12b
Textbook Question
"Finding the Coefficient of Determination and the Standard Error of Estimate In Exercises 11-20, use the data to (b) find the standard error of estimate s_e and interpret the result.
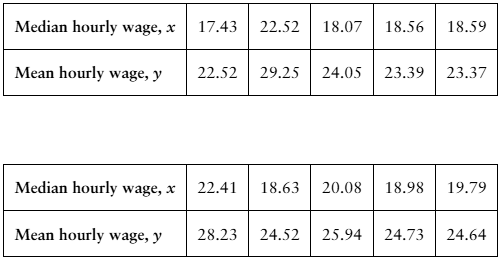
12. [APPLET] Median and Mean Hourly Wages The table shows the median and mean hourly wages (in dollars) in 10 states in a recent year. The equation of the regression line is y = 1.208x + 1.495. (Source: U.S. Census Bureau)
"

 Verified step by step guidance
1
Step 1: Understand the problem. You are tasked with finding the standard error of estimate (s_e) using the given data and interpreting the result. The regression equation provided is y = 1.208x + 1.495, where x represents the median hourly wage and y represents the mean hourly wage.
Step 2: Calculate the predicted values (ŷ) for each x value using the regression equation. Substitute each x value from the table into the equation y = 1.208x + 1.495 to compute the corresponding predicted y values.
Step 3: Compute the residuals for each data point. The residual for each data point is calculated as the difference between the observed y value and the predicted y value: residual = y - ŷ.
Step 4: Square each residual and sum them up. This gives the sum of squared residuals (SSR), which is a measure of the total deviation of the observed values from the predicted values.
Step 5: Use the formula for the standard error of estimate: s_e = sqrt(SSR / (n - 2)), where n is the number of data points. Divide the SSR by (n - 2) and take the square root to find s_e. Interpret the result as the average distance that the observed values fall from the regression line.
 Verified video answer for a similar problem:
This video solution was recommended by our tutors as helpful for the problem above
Video duration:
3mPlay a video:
0 Comments
Key Concepts
Here are the essential concepts you must grasp in order to answer the question correctly.
Coefficient of Determination (R²)
The Coefficient of Determination, denoted as R², measures the proportion of variance in the dependent variable that can be predicted from the independent variable. It ranges from 0 to 1, where 0 indicates no explanatory power and 1 indicates perfect prediction. A higher R² value suggests a stronger relationship between the variables, making it essential for evaluating the effectiveness of a regression model.
Recommended video:
Guided course

Coefficient of Determination
Standard Error of Estimate (s_e)
The Standard Error of Estimate (s_e) quantifies the accuracy of predictions made by a regression model. It represents the average distance that the observed values fall from the regression line. A smaller s_e indicates that the data points are closer to the predicted values, reflecting a more reliable model. It is calculated using the residuals, which are the differences between observed and predicted values.
Recommended video:
Guided course

Calculating Standard Deviation
Regression Line
A regression line is a straight line that best fits the data points in a scatter plot, representing the relationship between the independent variable (x) and the dependent variable (y). The equation of the regression line, typically in the form y = mx + b, includes a slope (m) and y-intercept (b). In this context, the regression line helps to predict mean hourly wages based on median hourly wages, providing insights into wage trends.
Recommended video:
Guided course

Using Regression Lines to Predict Values

 7:38m
7:38mWatch next
Master Residuals and Residual Plots with a bite sized video explanation from Patrick
Start learningRelated Videos
Related Practice
Multiple Choice
In a regression context, what does a negative residual indicate?
7
views
