Here are the essential concepts you must grasp in order to answer the question correctly.
Probability
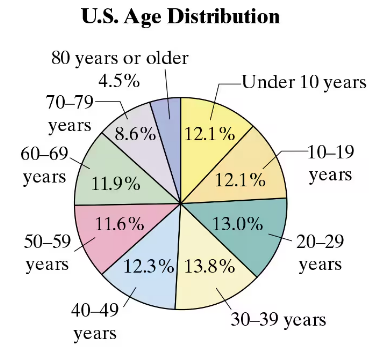
Probability is a measure of the likelihood that a particular event will occur, expressed as a number between 0 and 1. In this context, it involves calculating the chance of randomly selecting an individual from a specific age group based on the distribution percentages shown in the pie chart.
Recommended video:
Introduction to Probability
Complementary Events
Complementary events are pairs of outcomes in probability that cover all possible outcomes of an experiment. For instance, in this question, selecting someone who is not 60 years or older is the complement of selecting someone who is 60 years or older, allowing for easier probability calculations.
Recommended video:
Pie Chart Interpretation
A pie chart visually represents data in a circular format, where each slice corresponds to a category's proportion of the whole. Understanding how to read the pie chart is crucial for determining the age distribution percentages, which are necessary for calculating the required probabilities.
Recommended video: