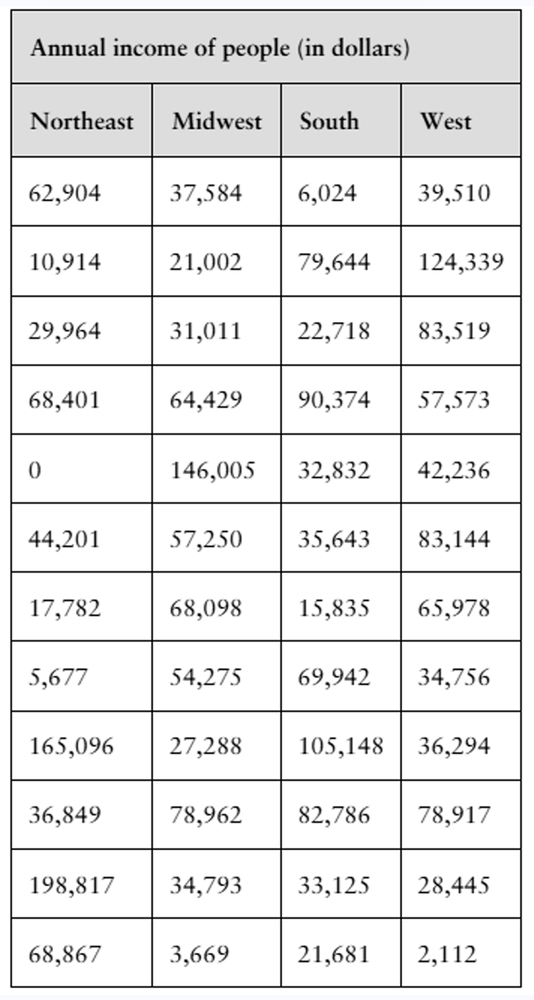
The National Bureau of Economic Research (NBER) is a private, nonprofit, nonpartisan research organization. The NBER provides information for better understanding of how the U.S. economy works. Researchers at the NBER concentrate on four types of empirical research: developing new statistical measurements, estimating quantitative models of economic behavior, assessing the effects of public policies on the U.S. economy, and projecting the effects of alternative policy proposals.One of the NBER’s interests is the median income of people in different regions of the United States. The table at the right shows the annual incomes (in dollars) of a random sample of people (15 years and over) in a recent year in four U.S. regions: Northeast, Midwest, South, and West. In Exercises 1–5, refer to the annual incomes of people in the table. Use for all tests. Use technology to perform a sign test to test the claim that the median annual income in the Midwest is greater than $30,000.
Verified step by step guidance
1
Step 1: Identify the data for the Midwest region from the table. These are the annual incomes of people in the Midwest: 37,584; 21,002; 31,011; 64,429; 146,005; 57,250; 68,098; 54,275; 27,288; 78,962; 34,793; 3,669.
Step 2: Formulate the null hypothesis (H₀) and the alternative hypothesis (H₁). H₀: The median annual income in the Midwest is less than or equal to $30,000. H₁: The median annual income in the Midwest is greater than $30,000.
Step 3: Perform a sign test. For each data point in the Midwest region, compare the income to $30,000. Count the number of incomes greater than $30,000 (positive signs) and the number of incomes less than $30,000 (negative signs). Ignore incomes equal to $30,000.
Step 4: Use technology or statistical software to calculate the p-value for the sign test based on the number of positive and negative signs. The significance level (α) is typically set at 0.05.
Step 5: Compare the p-value to the significance level (α). If the p-value is less than α, reject the null hypothesis (H₀) and conclude that the median annual income in the Midwest is greater than $30,000. Otherwise, fail to reject the null hypothesis.
Verified video answer for a similar problem:
This video solution was recommended by our tutors as helpful for the problem above
Video duration:
10m
Play a video:
Was this helpful?
Key Concepts
Here are the essential concepts you must grasp in order to answer the question correctly.
Median Income
The median income is the middle value of a data set when it is ordered from least to greatest. It is a measure of central tendency that is less affected by outliers and skewed data than the mean. In the context of the NBER's research, understanding median income helps to assess economic conditions across different regions.
The sign test is a non-parametric statistical method used to determine if there is a significant difference between the median of a sample and a specified value. It is particularly useful when the data does not meet the assumptions required for parametric tests. In this case, it will help test the claim that the median income in the Midwest is greater than $30,000.
Hypothesis testing is a statistical procedure that allows researchers to make inferences about a population based on sample data. It involves formulating a null hypothesis (e.g., the median income is less than or equal to $30,000) and an alternative hypothesis (e.g., the median income is greater than $30,000). The outcome of the test will help determine whether to reject or fail to reject the null hypothesis.