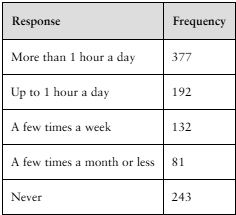
"Use the Internet? The Gallup organization conducted a survey in which 1025 randomly sampled adult Americans were asked, “How much time, if at all, do you personally spend using the Internet—more than 1 hour a day, up to 1 hour a day, a few times a week, a few times a month or less, or never?” The results of the survey were as follows: a. Construct a relative frequency distribution."
Verified step by step guidance
1
Step 1: Understand that a relative frequency distribution shows the proportion of the total number of observations that fall into each category. It is calculated by dividing the frequency of each category by the total number of observations.
Step 2: Calculate the total number of observations by summing all the frequencies given in the table. In this case, add 377 + 192 + 132 + 81 + 243 to get the total sample size.
Step 3: For each response category, divide its frequency by the total number of observations to find the relative frequency. For example, for 'More than 1 hour a day', calculate the relative frequency as \(\frac{377}{1025}\).
Step 4: Repeat the division for each category: 'Up to 1 hour a day', 'A few times a week', 'A few times a month or less', and 'Never'. Each relative frequency will be a decimal value between 0 and 1.
Step 5: Optionally, convert each relative frequency to a percentage by multiplying by 100 to express the proportion in percentage terms, which can make interpretation easier.
Verified video answer for a similar problem:
This video solution was recommended by our tutors as helpful for the problem above
Video duration:
3m
Play a video:
0 Comments
Key Concepts
Here are the essential concepts you must grasp in order to answer the question correctly.
Frequency Distribution
A frequency distribution is a summary of data that shows the number of observations within each category or class. It helps organize raw data into a more understandable form by listing categories alongside their corresponding counts or frequencies.
Relative frequency represents the proportion or percentage of the total number of observations that fall into each category. It is calculated by dividing the frequency of a category by the total number of observations, providing a normalized view of the data.
To construct a relative frequency distribution, first find the total number of observations, then divide each category's frequency by this total. The result is a set of relative frequencies that sum to 1 (or 100%), allowing comparison across categories regardless of sample size.

 Verified step by step guidance
 06:38
06:38