Degrees of Freedom In Exercise 20 “Blanking Out on Tests,” using the “smaller of n1-1 and n2-1” for the number of degrees of freedom results in df=15 Find the number of degrees of freedom using Formula 9-1. In general, how are hypothesis tests and confidence intervals affected by using Formula 9-1 instead of the “smaller of n1-1 and n2-1 ”?
Table of contents
- 1. Intro to Stats and Collecting Data55m
- 2. Describing Data with Tables and Graphs1h 55m
- 3. Describing Data Numerically1h 45m
- 4. Probability2h 16m
- 5. Binomial Distribution & Discrete Random Variables2h 33m
- 6. Normal Distribution and Continuous Random Variables1h 38m
- 7. Sampling Distributions & Confidence Intervals: Mean1h 53m
- 8. Sampling Distributions & Confidence Intervals: Proportion1h 12m
- 9. Hypothesis Testing for One Sample2h 19m
- 10. Hypothesis Testing for Two Samples3h 26m
- 11. Correlation1h 6m
- 12. Regression1h 35m
- 13. Chi-Square Tests & Goodness of Fit1h 57m
- 14. ANOVA1h 0m
9. Hypothesis Testing for One Sample
Steps in Hypothesis Testing
Problem 9.2.9a
Textbook Question
In Exercises 5–20, assume that the two samples are independent simple random samples selected from normally distributed populations, and do not assume that the population standard deviations are equal. (Note: Answers in Appendix D include technology answers based on Formula 9-1 along with “Table” answers based on Table A-3 with df equal to the smaller of n1-1 and n2-1)
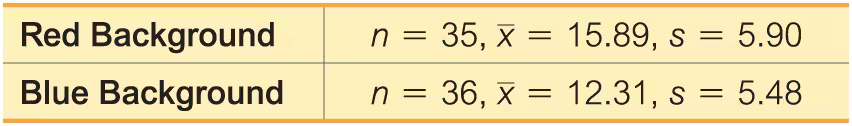
Color and Cognition Researchers from the University of British Columbia conducted a study to investigate the effects of color on cognitive tasks. Words were displayed on a computer screen with background colors of red and blue. Results from scores on a test of word recall are given below. Higher scores correspond to greater word recall.
a. Use a 0.05 significance level to test the claim that the samples are from populations with the same mean.


1
Step 1: State the null hypothesis (H₀) and the alternative hypothesis (H₁). The null hypothesis is H₀: μ₁ = μ₂ (the population means are equal), and the alternative hypothesis is H₁: μ₁ ≠ μ₂ (the population means are not equal).
Step 2: Identify the significance level (α). The problem specifies a significance level of 0.05.
Step 3: Calculate the test statistic using the formula for a two-sample t-test for independent samples: t = (x̄₁ - x̄₂) / √((s₁²/n₁) + (s₂²/n₂)), where x̄₁ and x̄₂ are the sample means, s₁ and s₂ are the sample standard deviations, and n₁ and n₂ are the sample sizes.
Step 4: Determine the degrees of freedom (df) using the formula: df = min(n₁ - 1, n₂ - 1). In this case, df = min(35 - 1, 36 - 1) = 34.
Step 5: Compare the calculated t-value to the critical t-value from the t-distribution table at df = 34 and α = 0.05 (two-tailed test). If the calculated t-value exceeds the critical t-value, reject the null hypothesis; otherwise, fail to reject the null hypothesis.

This video solution was recommended by our tutors as helpful for the problem above
Video duration:
7mPlay a video:
Was this helpful?
Key Concepts
Here are the essential concepts you must grasp in order to answer the question correctly.
Independent Samples
Independent samples refer to two or more groups that are not related or paired in any way. In this context, the red and blue background groups are independent, meaning the performance of one group does not influence the other. This is crucial for applying statistical tests that compare means, as the assumption of independence affects the validity of the results.
Recommended video:
Sampling Distribution of Sample Proportion
Hypothesis Testing
Hypothesis testing is a statistical method used to determine if there is enough evidence to reject a null hypothesis in favor of an alternative hypothesis. In this case, the null hypothesis states that the means of the two populations (red and blue backgrounds) are equal. The significance level of 0.05 indicates the threshold for deciding whether to reject the null hypothesis based on the test results.
Recommended video:
Guided course
Step 1: Write Hypotheses
t-Test for Independent Samples
A t-test for independent samples is used to compare the means of two groups when the population standard deviations are unknown and assumed to be unequal. This test calculates a t-statistic based on the sample means, sizes, and standard deviations, allowing researchers to assess whether the observed difference in means is statistically significant at a specified significance level.
Recommended video:
Sampling Distribution of Sample Proportion
Watch next
Master Step 1: Write Hypotheses with a bite sized video explanation from Patrick
Start learningRelated Videos
Related Practice
Textbook Question
37
views