
Textbook Question
Using and Interpreting Concepts
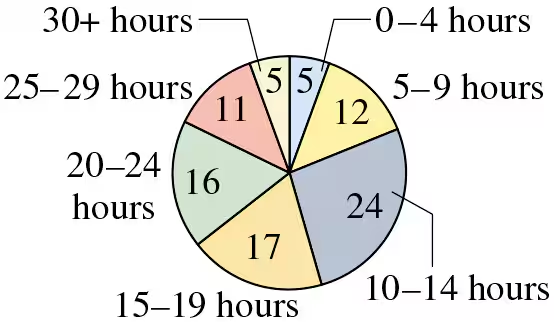
Finding the Range of a Data Set In Exercises 9 and 10, find the range of the data set represented by the graph.
114
views
 Verified step by step guidanceVerified video answer for a similar problem:
 06:38
06:38 05:11
05:11 08:45
08:45