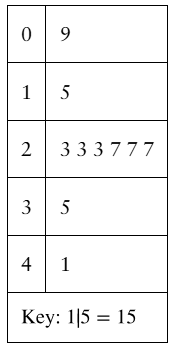
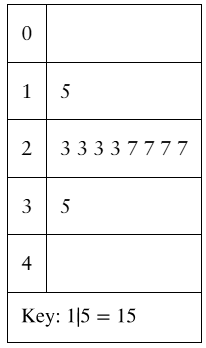
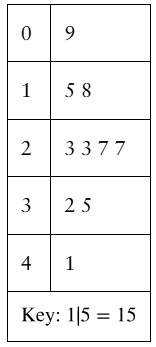
Use the frequency distribution in Exercise 4 to estimate the sample mean and sample standard deviation of the data. Do the formulas for grouped data give results that are as accurate as the individual entry formulas? Explain.
Table of contents
- 1. Intro to Stats and Collecting Data55m
- 2. Describing Data with Tables and Graphs1h 55m
- 3. Describing Data Numerically1h 45m
- 4. Probability2h 16m
- 5. Binomial Distribution & Discrete Random Variables2h 33m
- 6. Normal Distribution and Continuous Random Variables1h 38m
- 7. Sampling Distributions & Confidence Intervals: Mean1h 53m
- 8. Sampling Distributions & Confidence Intervals: Proportion1h 12m
- 9. Hypothesis Testing for One Sample2h 19m
- 10. Hypothesis Testing for Two Samples3h 22m
- 11. Correlation1h 6m
- 12. Regression1h 4m
- 13. Chi-Square Tests & Goodness of Fit1h 20m
- 14. ANOVA1h 0m
3. Describing Data Numerically
Standard Deviation
Problem 2.4.23
Textbook Question
Graphical Analysis In Exercises 21–24, you are asked to compare three data sets.
(c) Estimate the sample standard deviations. Then determine how close each of your estimates is by finding the sample standard deviations.
i.
ii.
iii. 

1
Step 1: Extract the data points from each stem-and-leaf plot. For example, in the first plot, the data points are 9, 15, 18, 23, 23, 27, 32, 35, and 41. Repeat this process for the other two plots.
Step 2: Calculate the mean (average) for each data set. Use the formula: , where represents each data point and is the total number of data points.
Step 3: Compute the deviations from the mean for each data point in each data set. Subtract the mean from each data point to find the deviation.
Step 4: Square each deviation and calculate the average of these squared deviations. This is the variance, calculated using the formula: .
Step 5: Take the square root of the variance to find the sample standard deviation for each data set. Use the formula: .

This video solution was recommended by our tutors as helpful for the problem above
Video duration:
11mPlay a video:
Was this helpful?
Key Concepts
Here are the essential concepts you must grasp in order to answer the question correctly.
Sample Standard Deviation
The sample standard deviation is a measure of the amount of variation or dispersion in a set of values. It quantifies how much the individual data points deviate from the sample mean. A low standard deviation indicates that the data points tend to be close to the mean, while a high standard deviation indicates a wider spread of values.
Recommended video:
Guided course
Calculating Standard Deviation
Estimating Standard Deviation
Estimating the sample standard deviation involves using visual data representations, such as graphs, to gauge the spread of data points. This can be done by observing the range and clustering of values in the data set. While estimates provide a quick insight, they should be verified with actual calculations for accuracy.
Recommended video:
Guided course
Calculating Standard Deviation
Data Set Comparison
Comparing data sets involves analyzing their statistical properties, such as means, medians, and standard deviations, to understand their differences and similarities. This comparison can reveal trends, patterns, or anomalies within the data, aiding in decision-making or hypothesis testing in research.
Recommended video:
Introduction to Collecting Data
Watch next
Master Calculating Standard Deviation with a bite sized video explanation from Patrick
Start learningRelated Videos
Related Practice
Textbook Question
30
views