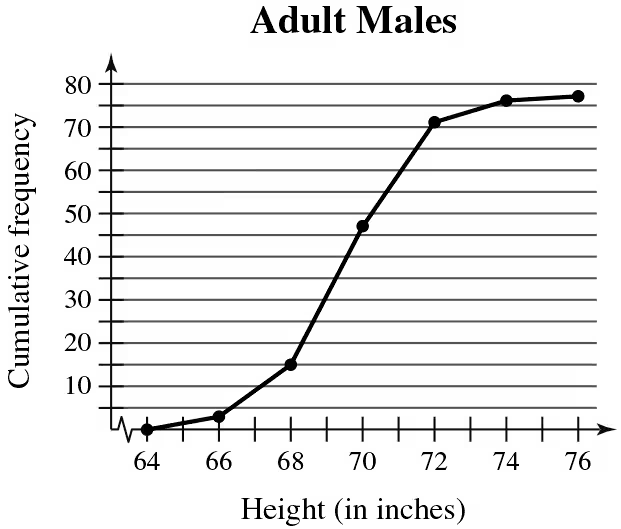
Use the ogive to approximate the height for which the cumulative frequency is 15.
Verified step by step guidance
1
Step 1: Understand the ogive graph. An ogive is a cumulative frequency graph that shows the cumulative frequency of data points up to a certain value. The x-axis represents the height (in inches), and the y-axis represents the cumulative frequency.
Step 2: Locate the cumulative frequency of 15 on the y-axis. This is the target value for which we need to approximate the corresponding height.
Step 3: Draw a horizontal line from the cumulative frequency value of 15 on the y-axis until it intersects the ogive curve.
Step 4: From the point of intersection, draw a vertical line down to the x-axis. This will give the approximate height corresponding to the cumulative frequency of 15.
Step 5: Read the value on the x-axis where the vertical line meets it. This is the approximate height for which the cumulative frequency is 15.
Verified video answer for a similar problem:
This video solution was recommended by our tutors as helpful for the problem above
Video duration:
1m
Play a video:
0 Comments
Key Concepts
Here are the essential concepts you must grasp in order to answer the question correctly.
Ogive
An ogive is a graphical representation of cumulative frequency. It is constructed by plotting the cumulative frequency against the upper boundaries of the class intervals. The resulting curve helps visualize how many observations fall below a particular value, making it easier to determine percentiles and other statistical measures.
Cumulative Frequency
Cumulative frequency is the running total of frequencies up to a certain point in a dataset. It shows the number of observations that fall below or at a specific value. This concept is crucial for understanding distributions and is often used in conjunction with ogives to analyze data trends and percentiles.
Interpolation is a statistical method used to estimate unknown values that fall within the range of a discrete set of known data points. In the context of the ogive, interpolation allows us to approximate the height corresponding to a specific cumulative frequency, such as 15, by finding the point on the curve that aligns with that frequency.

 Verified step by step guidance
 04:41
04:41