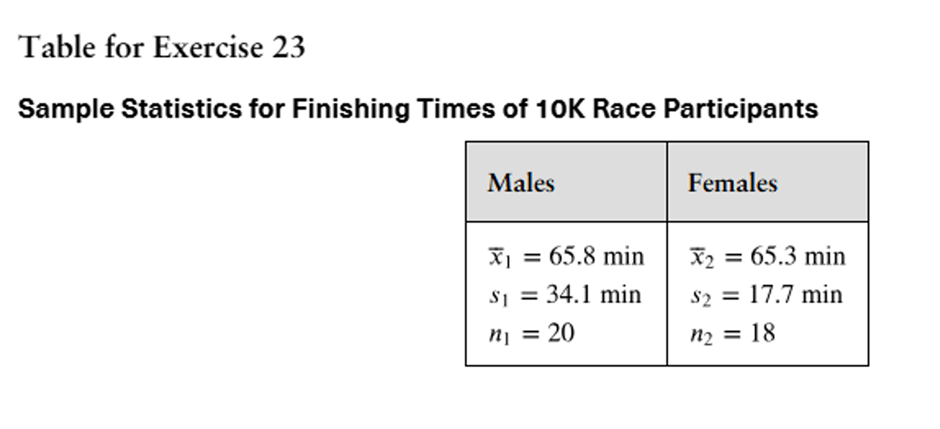
Constructing Confidence Intervals for μ1-μ2, When the sampling distribution for x̅1-x̅2 is approximated by a t-distribution and the population variances are not equal, you can construct a confidence interval for μ1-μ2 , as shown below. construct the indicated confidence interval for μ1-μ2 . Assume the populations are approximately normal with unequal variances. 10K Race To compare the mean finishing times of male and female participants in a 10K race, you randomly select several finishing times from both sexes. The results are shown at the left. Construct an 80% confidence interval for the difference in mean finishing times of male and female participants in the race. (Adapted from Great Race)
Verified step by step guidance
1
Step 1: Identify the given statistics for both groups. For males: sample mean (x̄₁) = 65.8, sample standard deviation (s₁) = 34.1, and sample size (n₁) = 20. For females: sample mean (x̄₂) = 65.3, sample standard deviation (s₂) = 17.7, and sample size (n₂) = 18.
Step 2: Write the formula for the confidence interval for μ₁ - μ₂ when population variances are unequal. The formula is: CI = (x̄₁ - x̄₂) ± t* × √((s₁²/n₁) + (s₂²/n₂)), where t* is the critical t-value for the given confidence level and degrees of freedom.
Step 3: Calculate the degrees of freedom using the formula for unequal variances: df = ((s₁²/n₁ + s₂²/n₂)²) / (((s₁²/n₁)² / (n₁ - 1)) + ((s₂²/n₂)² / (n₂ - 1))). This will help determine the appropriate t* value for the 80% confidence level.
Step 4: Look up the critical t-value (t*) for the calculated degrees of freedom and the 80% confidence level. Use a t-distribution table or statistical software to find this value.
Step 5: Substitute the values for x̄₁, x̄₂, s₁, s₂, n₁, n₂, and t* into the confidence interval formula to compute the interval bounds. Ensure all calculations are performed step by step to avoid errors.
Verified video answer for a similar problem:
This video solution was recommended by our tutors as helpful for the problem above
Video duration:
5m
Play a video:
0 Comments
Key Concepts
Here are the essential concepts you must grasp in order to answer the question correctly.
Confidence Interval
A confidence interval is a range of values, derived from sample statistics, that is likely to contain the true population parameter. It is expressed with a certain level of confidence, such as 80%, indicating the probability that the interval includes the parameter. In this case, it will estimate the difference in mean finishing times between male and female participants in the 10K race.
The t-distribution is a type of probability distribution that is symmetric and bell-shaped, similar to the normal distribution but with heavier tails. It is used when estimating population parameters when the sample size is small or when the population variance is unknown. In this scenario, the t-distribution is appropriate due to the unequal variances of the two groups being compared.
Unequal variances, also known as heteroscedasticity, occur when two or more groups have different levels of variability in their data. This is important in statistical analysis because it affects the validity of certain tests and confidence intervals. In this case, the sample variances of male and female finishing times differ significantly, necessitating the use of specific formulas for constructing the confidence interval.

 Verified step by step guidance
 06:33
06:33
