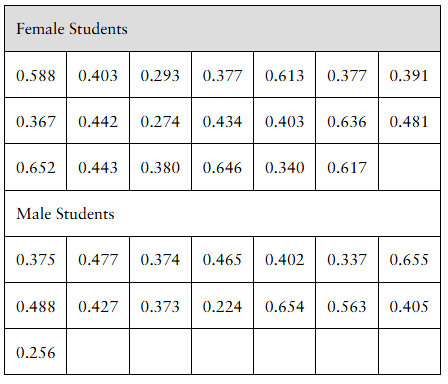
Measuring Reaction Time Researchers at the University of Mississippi wanted to discover whether variability for reaction time to a go/no go stimulus of males was different from that of females. The researchers randomly selected 20 females and 15 males to participate in the study. The go/no go stimulus required the student to respond to a particular stimulus and not to respond to other stimuli. The data are as follows:
b. Draw boxplots of each data set, using the same scale. Does this visual evidence support the results obtained in part (a)?
Verified step by step guidance
1
Step 1: Organize the data for each group (female and male students) in ascending order to facilitate calculation of quartiles and other statistics needed for the boxplot.
Step 2: Calculate the five-number summary for each group: minimum, first quartile (Q1), median (Q2), third quartile (Q3), and maximum. These are essential components for constructing a boxplot.
Step 3: Determine the interquartile range (IQR) for each group by subtracting Q1 from Q3: \(\text{IQR} = Q3 - Q1\). This helps identify the spread of the middle 50% of the data.
Step 4: Identify any potential outliers using the 1.5 * IQR rule. Calculate the lower bound as \(Q1 - 1.5 \times IQR\) and the upper bound as \(Q3 + 1.5 \times IQR\). Data points outside these bounds are considered outliers and should be marked separately on the boxplot.
Step 5: Draw the boxplots for both female and male students on the same scale. The box represents the IQR, the line inside the box is the median, whiskers extend to the minimum and maximum values within the bounds, and outliers are plotted individually. Compare the spread and variability visually to assess if the male reaction times show more variability than the female reaction times, supporting or contradicting the results from part (a).
Verified video answer for a similar problem:
This video solution was recommended by our tutors as helpful for the problem above
Video duration:
4m
Play a video:
0 Comments
Key Concepts
Here are the essential concepts you must grasp in order to answer the question correctly.
Boxplots and Visual Data Representation
Boxplots graphically display the distribution of a data set through its quartiles, highlighting the median, spread, and potential outliers. Using the same scale for both groups allows direct visual comparison of variability and central tendency, making it easier to assess differences between male and female reaction times.
Variability refers to how spread out data points are in a data set, commonly measured by range, interquartile range (IQR), or standard deviation. Understanding variability helps determine if one group’s reaction times are more consistent or dispersed compared to another, which is central to comparing male and female reaction time differences.
Variance & Standard Deviation of Discrete Random Variables
Random Sampling and Study Design
Random sampling ensures that participants are selected without bias, making the sample representative of the population. This is crucial for the validity of conclusions about differences in reaction time variability between males and females, as it reduces confounding factors and supports generalizability.

 Verified step by step guidance
 04:39
04:39
