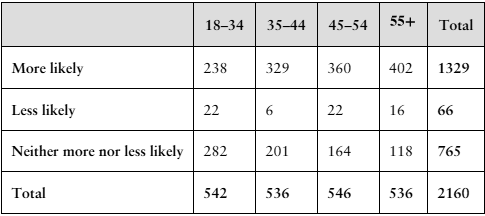
Made in America In a recent Harris Poll, a random sample of adult Americans (18 years and older) was asked, “When you see an ad emphasizing that a product is ‘Made in America,’ are you more likely to buy it, less likely to buy it, or neither more nor less likely to buy it?” The results of the survey, by age group, are presented in the contingency table below. f. Write a few sentences describing any observed relationship between the likelihood to buy and age.
Verified step by step guidance
1
Step 1: Calculate the proportion of respondents in each age group who are 'More likely' to buy products labeled 'Made in America'. For each age group, divide the count of 'More likely' responses by the total number of respondents in that age group. For example, for the 18-34 group, calculate \(\frac{238}{542}\).
Step 2: Repeat the same calculation for the 'Less likely' and 'Neither more nor less likely' categories within each age group. This will give you the relative frequencies or percentages for each response category by age group.
Step 3: Compare these proportions across the age groups to identify any trends or patterns. For instance, observe whether the proportion of 'More likely' responses increases or decreases as age increases.
Step 4: Summarize your observations by describing how the likelihood to buy 'Made in America' products varies with age. Mention if older age groups tend to be more or less likely to buy such products compared to younger groups, and note any significant differences in the 'Less likely' or 'Neutral' categories.
Step 5: Conclude by interpreting what these patterns might suggest about consumer behavior related to age and preference for 'Made in America' products, supporting your statements with the calculated proportions.
Verified video answer for a similar problem:
This video solution was recommended by our tutors as helpful for the problem above
Video duration:
1m
Play a video:
0 Comments
Key Concepts
Here are the essential concepts you must grasp in order to answer the question correctly.
Contingency Tables
A contingency table displays the frequency distribution of variables and helps analyze the relationship between categorical variables. In this case, it shows how different age groups respond to the likelihood of buying 'Made in America' products. Understanding how to read and interpret these tables is essential for identifying patterns or associations.
This concept involves determining whether and how two categorical variables relate to each other. Here, it means examining if age group influences the likelihood of buying a product labeled 'Made in America.' Observing differences in response proportions across age groups helps identify any association or trend.
Intro to Random Variables & Probability Distributions
Relative Frequency and Proportions
Relative frequency refers to the proportion of observations in each category relative to the total. Calculating proportions within each age group or response category allows for meaningful comparisons, revealing how buying likelihood varies by age. This helps avoid misleading conclusions based solely on raw counts.

 Verified step by step guidance
 08:18
08:18
