Here are the essential concepts you must grasp in order to answer the question correctly.
Frequency Distribution
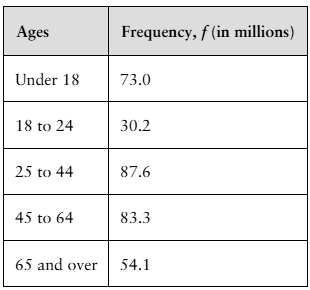
A frequency distribution is a summary of how often each value occurs in a dataset. It organizes data into categories (or bins) and shows the number of observations (frequency) for each category. In this case, the frequency distribution presents the population of the U.S. by age group, allowing for easy visualization of how many people fall into each age category.
Recommended video:
Intro to Frequency Distributions
Probability
Probability is a measure of the likelihood that a particular event will occur, expressed as a number between 0 and 1. In the context of the question, it involves calculating the probability that a randomly selected U.S. resident belongs to a specific age group, which can be determined by dividing the frequency of that age group by the total population.
Recommended video:
Introduction to Probability
Total Population
The total population refers to the sum of all individuals in the dataset being analyzed. To find the probability of a resident being in a specific age group, one must first calculate the total population by summing the frequencies of all age groups. This total serves as the denominator in the probability calculation, providing a context for the relative size of each age group.
Recommended video:
Population Standard Deviation Known