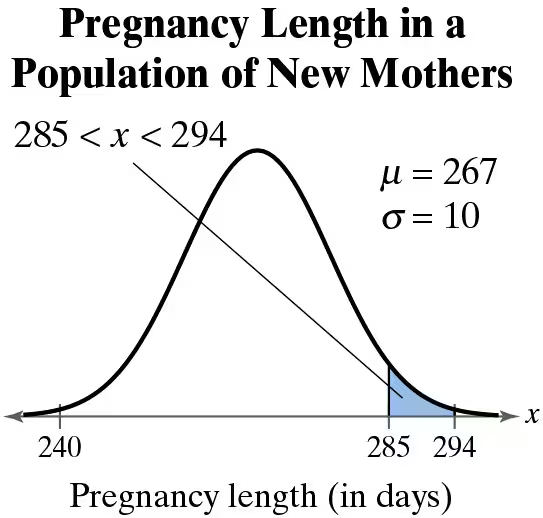
Graphical Analysis In Exercises 13–16, a member is selected at random from the population represented by the graph. Find the probability that the member selected at random is from the shaded region of the graph. Assume the variable x is normally distributed.
Verified step by step guidance
1
Step 1: Identify the key parameters of the normal distribution from the graph. The mean (μ) is given as 267 days, and the standard deviation (σ) is 10 days. The shaded region corresponds to the range 285 < x < 294.
Step 2: Convert the given range (285 < x < 294) into z-scores using the formula: . For x = 285 and x = 294, calculate the respective z-scores.
Step 3: Use a standard normal distribution table or software to find the cumulative probabilities corresponding to the calculated z-scores. The cumulative probability for z = (285 - 267)/10 and z = (294 - 267)/10 will be determined.
Step 4: Subtract the cumulative probability at z = 285 from the cumulative probability at z = 294 to find the probability of the shaded region. This gives the area under the curve between these two z-scores.
Step 5: Interpret the result as the probability that a randomly selected member of the population has a pregnancy length between 285 and 294 days.
Verified video answer for a similar problem:
This video solution was recommended by our tutors as helpful for the problem above
Video duration:
4m
Play a video:
0 Comments
Key Concepts
Here are the essential concepts you must grasp in order to answer the question correctly.
Normal Distribution
Normal distribution is a continuous probability distribution characterized by its bell-shaped curve, defined by its mean (μ) and standard deviation (σ). In this context, the pregnancy lengths are normally distributed, meaning most values cluster around the mean, with fewer values appearing as you move away from the mean in either direction.
Using the Normal Distribution to Approximate Binomial Probabilities
Probability
Probability quantifies the likelihood of an event occurring, expressed as a number between 0 and 1. In this scenario, we are interested in finding the probability that a randomly selected pregnancy length falls within a specific range (285 to 294 days), which can be calculated using the area under the normal distribution curve corresponding to that interval.
A Z-score indicates how many standard deviations an element is from the mean of a distribution. It is calculated using the formula Z = (X - μ) / σ. In this case, Z-scores can be used to standardize the values of 285 and 294, allowing us to find the corresponding probabilities from the standard normal distribution table.

 Verified step by step guidance
 06:23
06:23
