Here are the essential concepts you must grasp in order to answer the question correctly.
Standard Normal Distribution
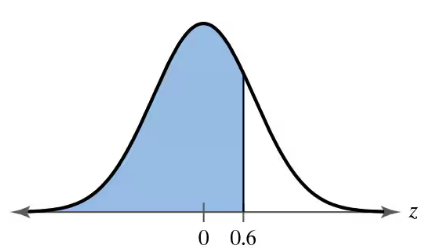
The standard normal distribution is a special case of the normal distribution where the mean is 0 and the standard deviation is 1. It is represented by the bell-shaped curve, and all values are expressed in terms of z-scores, which indicate how many standard deviations an element is from the mean. This distribution is crucial for statistical analysis, particularly in hypothesis testing and confidence intervals.
Recommended video:
Finding Standard Normal Probabilities using z-Table
Z-Score
A z-score is a statistical measurement that describes a value's relationship to the mean of a group of values. It is calculated by subtracting the mean from the value and then dividing by the standard deviation. Z-scores are essential for determining the position of a data point within a standard normal distribution, allowing for the comparison of scores from different distributions.
Recommended video:
Z-Scores From Given Probability - TI-84 (CE) Calculator
Area Under the Curve
In the context of the normal distribution, the area under the curve represents the probability of a random variable falling within a particular range. The total area under the curve is equal to 1, and specific areas can be calculated using z-scores and standard normal distribution tables or technology. This concept is fundamental for understanding probabilities and making inferences about populations based on sample data.
Recommended video:
Z-Scores from Probabilities