Table of contents
- 1. Intro to Stats and Collecting Data(0)
- 2. Describing Data with Tables and Graphs(0)
- 3. Describing Data Numerically(0)
- 4. Probability(0)
- 5. Binomial Distribution & Discrete Random Variables(0)
- 6. Normal Distribution and Continuous Random Variables(0)
- 7. Sampling Distributions & Confidence Intervals: Mean(0)
- 8. Sampling Distributions & Confidence Intervals: Proportion(0)
- 9. Hypothesis Testing for One Sample(0)
- 10. Hypothesis Testing for Two Samples(0)
- 11. Correlation(0)
- 12. Regression(0)
- 13. Chi-Square Tests & Goodness of Fit(0)
- 14. ANOVA(0)
12. Regression
Quadratic Regression
12. Regression
Quadratic Regression: Videos & Practice Problems
11 of 0
Problem 11Multiple Choice
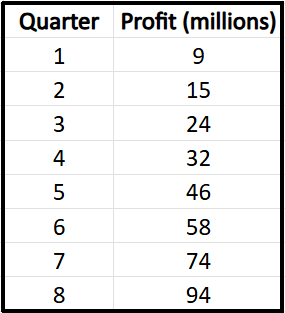
A small manufacturing company recorded its quarterly profits (in millions of dollars) over the first two years of operation. The data is as follows:

Your task is to analyze this data to identify the best-fitting mathematical model. Create a scatterplot of profit versus quarter number, then apply regression fits for each model and compare their goodness-of-fit using the coefficient of determination ().
0 Comments