Table of contents
- 1. Intro to Stats and Collecting Data(0)
- 2. Describing Data with Tables and Graphs(0)
- 3. Describing Data Numerically(0)
- 4. Probability(0)
- 5. Binomial Distribution & Discrete Random Variables(0)
- 6. Normal Distribution and Continuous Random Variables(0)
- 7. Sampling Distributions & Confidence Intervals: Mean(0)
- 8. Sampling Distributions & Confidence Intervals: Proportion(0)
- 9. Hypothesis Testing for One Sample(0)
- 10. Hypothesis Testing for Two Samples(0)
- 11. Correlation(0)
- 12. Regression(0)
- 13. Chi-Square Tests & Goodness of Fit(0)
- 14. ANOVA(0)
1. Intro to Stats and Collecting Data
Intro to Stats
1. Intro to Stats and Collecting Data
Intro to Stats: Videos & Practice Problems
13 of 0
Problem 13Multiple Choice
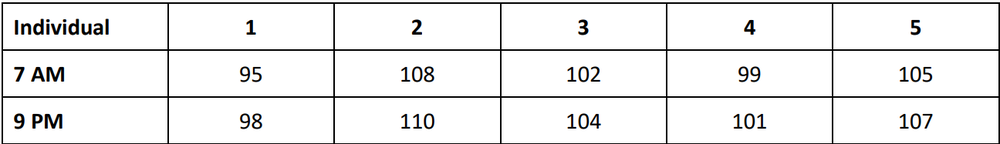
If we analyze the recorded blood sugar levels of five individuals using suitable statistical methods, we conclude that when the differences are found between the 7 AM and 9 PM blood sugar levels, there is a 58% chance that these differences can be explained by random results obtained from populations that have the same 7 AM and 9 PM blood sugar levels. The data is presented in the following table.

Question:
What conclusions should we draw regarding the statistical significance of the observed differences in blood sugar levels?
0 Comments