Table of contents
- 1. Intro to Stats and Collecting Data(0)
- 2. Describing Data with Tables and Graphs(0)
- 3. Describing Data Numerically(0)
- 4. Probability(0)
- 5. Binomial Distribution & Discrete Random Variables(0)
- 6. Normal Distribution and Continuous Random Variables(0)
- 7. Sampling Distributions & Confidence Intervals: Mean(0)
- 8. Sampling Distributions & Confidence Intervals: Proportion(0)
- 9. Hypothesis Testing for One Sample(0)
- 10. Hypothesis Testing for Two Samples(0)
- 11. Correlation(0)
- 12. Regression(0)
- 13. Chi-Square Tests & Goodness of Fit(0)
- 14. ANOVA(0)
3. Describing Data Numerically
Median
3. Describing Data Numerically
Median: Videos & Practice Problems
13 of 0
Problem 13Multiple Choice
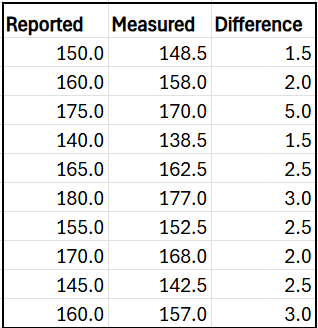
The self-reported weights of adults aged 25 and over, along with their corresponding measured weights and the differences between reported and measured weights, are provided in the table below. All weights are in pounds.

Using the differences between reported and measured weights, determine the values of:
Q1 (First Quartile)
Q3 (Third Quartile)
0 Comments