Table of contents
- 1. Intro to Stats and Collecting Data(0)
- 2. Describing Data with Tables and Graphs(0)
- 3. Describing Data Numerically(0)
- 4. Probability(0)
- 5. Binomial Distribution & Discrete Random Variables(0)
- 6. Normal Distribution and Continuous Random Variables(0)
- 7. Sampling Distributions & Confidence Intervals: Mean(0)
- 8. Sampling Distributions & Confidence Intervals: Proportion(0)
- 9. Hypothesis Testing for One Sample(0)
- 10. Hypothesis Testing for Two Samples(0)
- 11. Correlation(0)
- 12. Regression(0)
- 13. Chi-Square Tests & Goodness of Fit(0)
- 14. ANOVA(0)
13. Chi-Square Tests & Goodness of Fit
Contingency Tables
13. Chi-Square Tests & Goodness of Fit
Contingency Tables: Videos & Practice Problems
32 of 0
Problem 32Multiple Choice
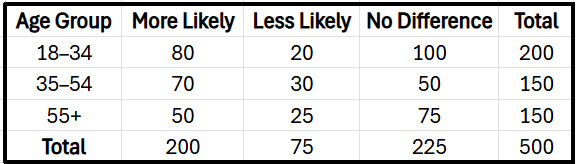
A survey asked three age groups about their likelihood of buying a product labeled "made locally" with responses "more likely", "less likely", and "no difference". The observed counts are shown in the table below. Construct the conditional distribution of responses based on age, using age as the explanatory variable.

0 Comments