Table of contents
- 1. Intro to Stats and Collecting Data(0)
- 2. Describing Data with Tables and Graphs(0)
- 3. Describing Data Numerically(0)
- 4. Probability(0)
- 5. Binomial Distribution & Discrete Random Variables(0)
- 6. Normal Distribution and Continuous Random Variables(0)
- 7. Sampling Distributions & Confidence Intervals: Mean(0)
- 8. Sampling Distributions & Confidence Intervals: Proportion(0)
- 9. Hypothesis Testing for One Sample(0)
- 10. Hypothesis Testing for Two Samples(0)
- 11. Correlation(0)
- 12. Regression(0)
- 13. Chi-Square Tests & Goodness of Fit(0)
- 14. ANOVA(0)
13. Chi-Square Tests & Goodness of Fit
Contingency Tables
13. Chi-Square Tests & Goodness of Fit
Contingency Tables: Videos & Practice Problems

24 of 0
Problem 24Multiple Choice
A contingency table shows the number of adults (in units of thousands) in a city by employment status and level of education:
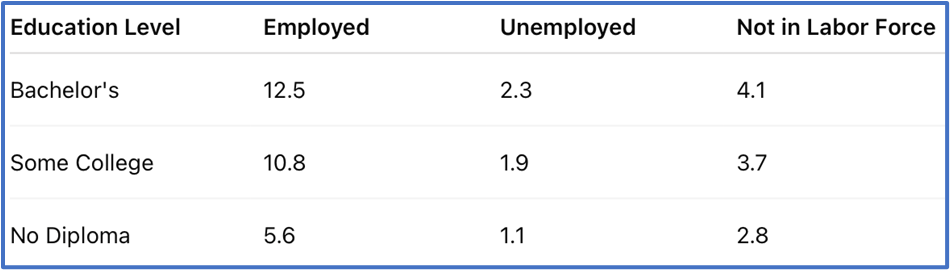
What percentage of adults (i) are employed and have some college, (ii) are unemployed, and (iii) have no diploma?
0 Comments