Table of contents
- 1. Intro to Stats and Collecting Data(0)
- 2. Describing Data with Tables and Graphs(0)
- 3. Describing Data Numerically(0)
- 4. Probability(0)
- 5. Binomial Distribution & Discrete Random Variables(0)
- 6. Normal Distribution and Continuous Random Variables(0)
- 7. Sampling Distributions & Confidence Intervals: Mean(0)
- 8. Sampling Distributions & Confidence Intervals: Proportion(0)
- 9. Hypothesis Testing for One Sample(0)
- 10. Hypothesis Testing for Two Samples(0)
- 11. Correlation(0)
- 12. Regression(0)
- 13. Chi-Square Tests & Goodness of Fit(0)
- 14. ANOVA(0)
13. Chi-Square Tests & Goodness of Fit
Goodness of Fit Test
13. Chi-Square Tests & Goodness of Fit
Goodness of Fit Test: Videos & Practice Problems
49 of 0
Problem 49Multiple Choice
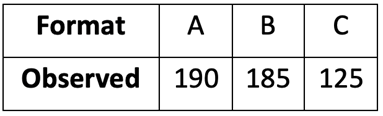
A university registrar wants to understand student enrollment patterns. Suppose a survey is set up where a student chooses between three different online course formats (A, B, or C). Assuming each student's choice is independent, the expected probability distribution for the chosen format is as follows:

Suppose the registrar collects data from a random sample of students, and the number of students who chose each format is recorded. The results are shown below.

Does the observed distribution of student choices follow the distribution expected by the registrar? Use the level of significance.
0 Comments